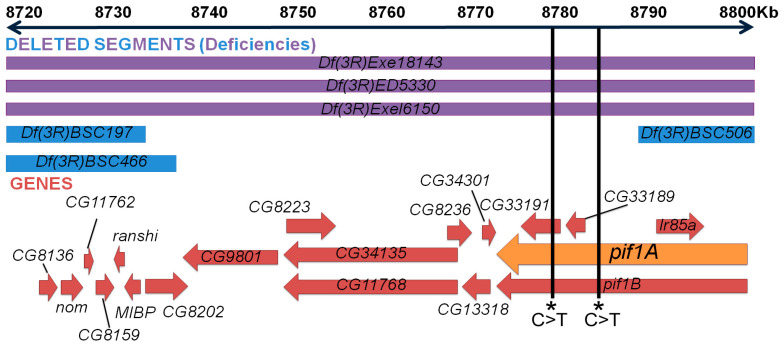
Figure 7.
Identifying candidate genes for Z3-5009 phenotype. Cytological map of area-of-interest (chromosome 3R) derived by deficiency crosses. Top blue and purple rectangles refer to genetic regions that the deficiency lines are lacking—the sequences deleted extend beyond the constraints of this figure. Purple represents deficiency lines that failed to complement the mutant phenotype; blue represents lines that complemented (are fertile). In the lower portion, red arrows represent genes in the area-of-interest, and the orange arrow represents the gene thought to be responsible, Pif1A.

