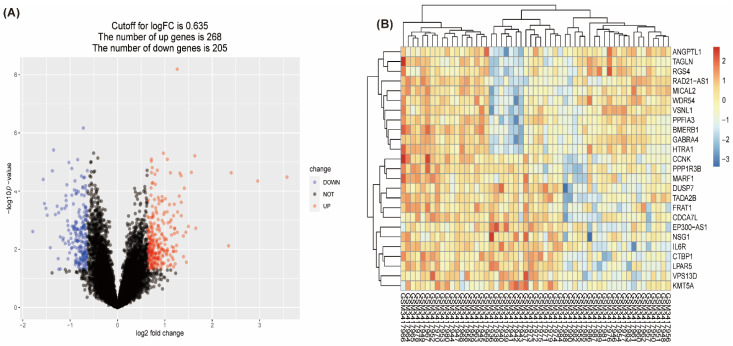
Figure 2.
Volcano plot and heatmap for differentially expressed genes identified in the GSE120895 dataset; red indicates upregulated genes, and blue indicates downregulated genes. (A) The volcano plot shows up- and downregulated genes. (B) The heatmap shows the expression of the 25 most differentiated genes in individuals.

