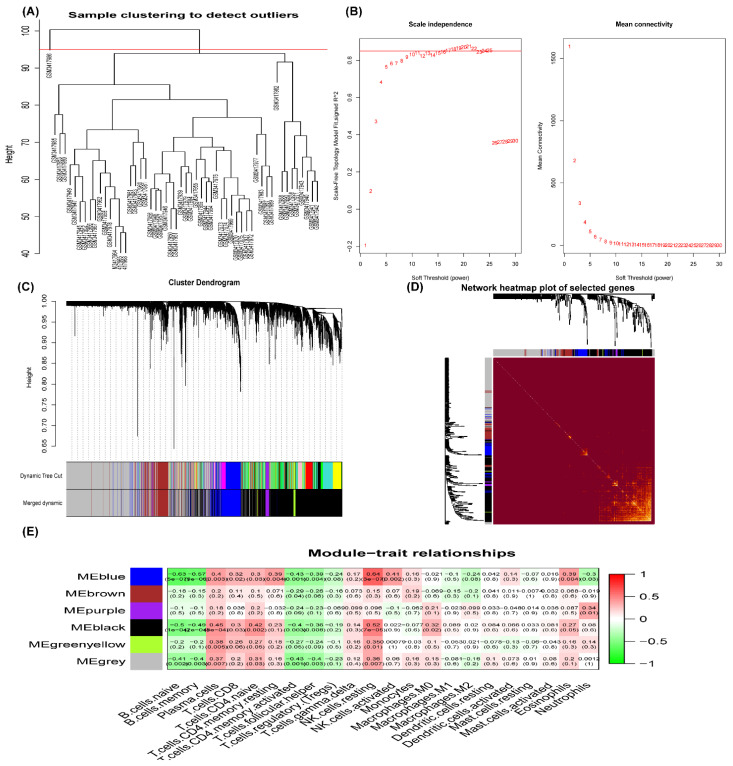
Figure 5.
Weighted gene coexpression network analysis (WGCNA) for GSE120895. (A) The sample clustering to detect an outlier. (B) Analysis of the scale-free index (left) and mean connectivity (right) for various threshold powers. ß = 17 (scale-free R2, 0.85) was chosen as the soft threshold. (C) Clustering dendrogram of genes, together with assigned module colors. Merge modules with a similarity of 0.85. (D) Network heatmap plot in the coexpression modules. Light color represents higher overlap. (E) Module–trait relationships; the numbers in the cell represent the correlation coefficient and corresponding p-value. The correlation coefficient is between −1 and +1, and the larger the absolute value, the stronger the association.

