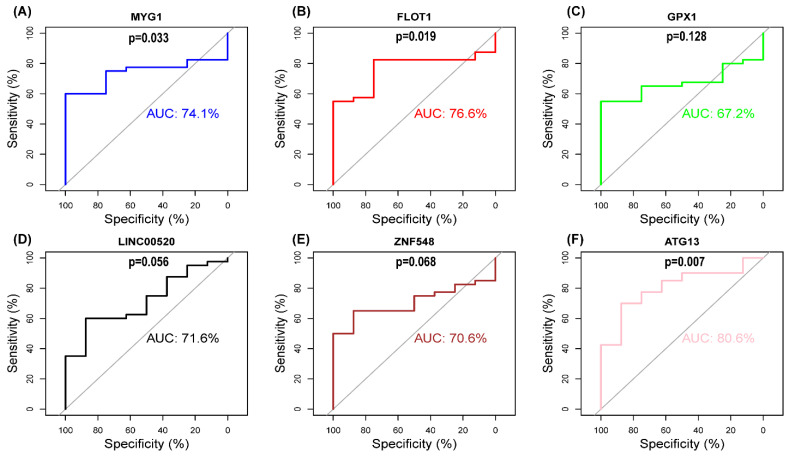
Figure 8.
Receiver operating characteristic (ROC) curves of hub genes in GSE17800. (A) ROC curves of MYG1. (B) ROC curves of FLOT1. (C) ROC curves of GPX1. (D) ROC curves of LINC00520. (E) ROC curves of ZNF548. (F) ROC curves of ATG13. AUC > 0.7 indicates good effect.

