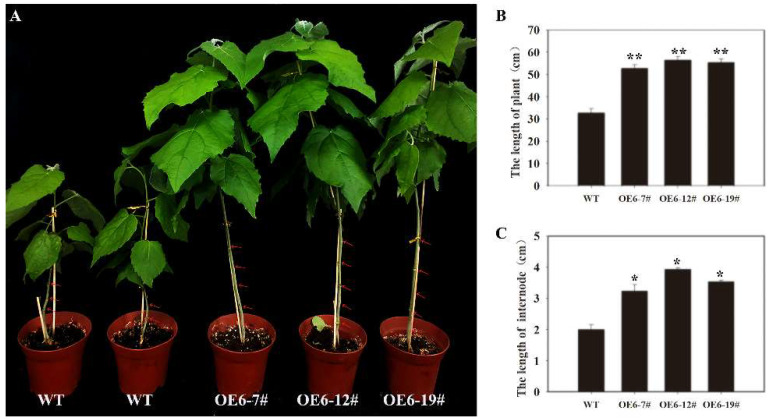
Figure 8.
The phenotype analysis of PtoNF-YC6 transgenic P. tomentosa. (A) PtoNF-YC6 transgenic P. tomentosa plants with different growth phenotype. (B) Plant height analysis of PtoNF-YC6 transgenic P. tomentosa plants. (C) Internode statistical analysis of PtoNF-YC6 transgenic P. tomentosa plants. * (p < 0.05) and ** (p < 0.01) indicate significant differences. Subfigure A red arrows represent internodes.

