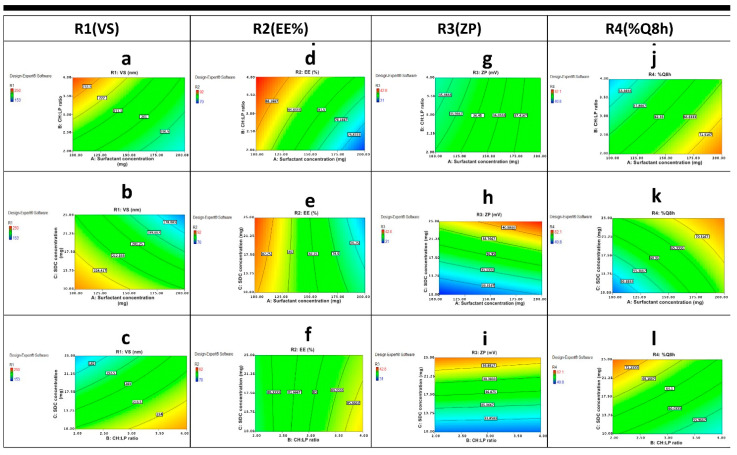
Figure 3.
Contour plots of the effect of variables; (A) surfactant concentration, (B) CH:LP molar ratio, and (C) SDC concentration on different of responses R1 (VS), R2 (EE%), R3 (ZP) and R4 (%Q8 h) following: (a) the effect of A and B on R1, (b) the effect of A and C on R1, (c) the effect of B and C on R1, (d) the effect of A and B on R2, (e) the effect of A and C on R2, (f) the effect of B and C on R2, (g) the effect of A and B on R3, (h) the effect of A and C on R3, (i) the effect of B and C on R3, (j) the effect of A and B on R4, (k) the effect of A and C on R4, and (l) the effect of B and C on R4.

