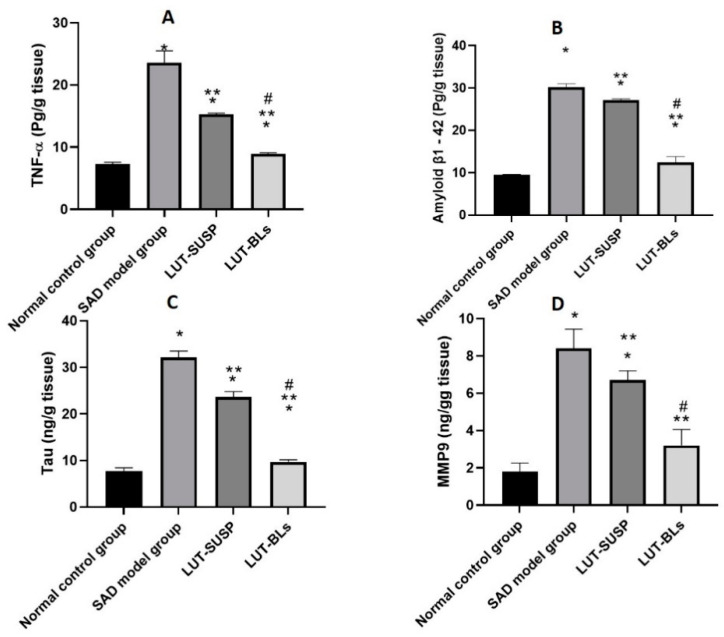
Figure 8.
Biochemical analysis of (A) TNF-α level, (B) amyloid β1-42 level, (C) tau level, and (D) MMP9 level. Animals were divided into four groups, one of which was designated as the normal control group. The second group received STZ (3 mg/kg, ICV). The remaining two groups were injected first with STZ (3 mg/kg, ICV), followed by injection with luteolin suspension (50 mg/kg, i.n. for 21 days) and luteolin-loaded bilosomes (50 mg/kg, i.n. for 21 days), respectively. The brain of the animals (n = 8) in each group was retrieved and homogenized as 10% homogenate in 0.1 M PBS before being centrifuged, and supernatants were used further analyses. Statistical analyses were performed using one-way analysis of variance (ANOVA) followed by the Tukey–Kramer post hoc test, whereby each value was presented as mean ± standard deviation (SD). * Statistically significantly different from the normal control group (p < 0.05); ** statistically significantly different from the STZ group, 3 mg/kg (p < 0.05); # statistically significantly different from the LUT suspension group, 50 mg/kg (p < 0.05).

