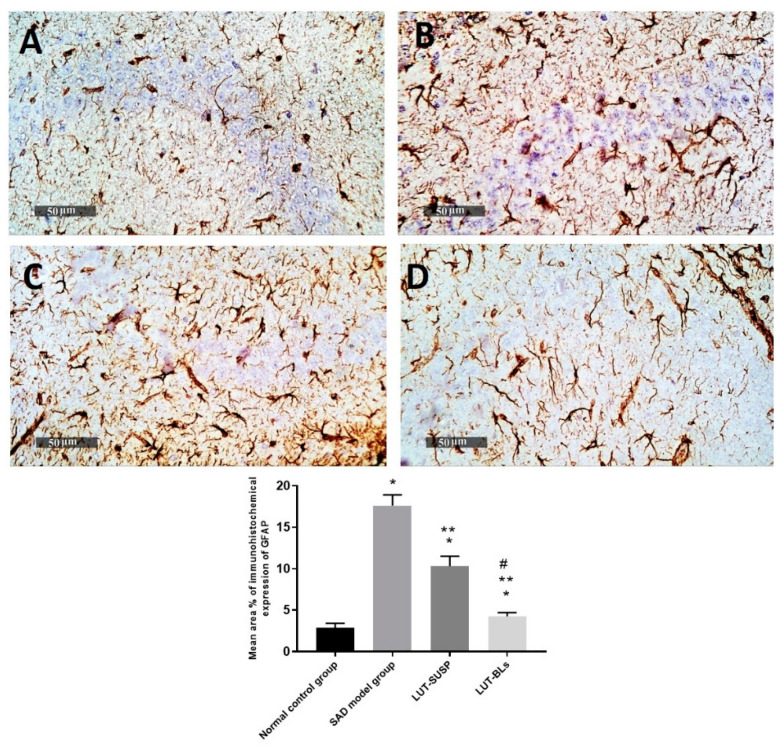
Figure 11.
Hippocampal GFAP immunohistochemical expression levels in reactive astrocytes expressed as the mean area percentage of expression. (A) normal controls, (B) model AD samples, (C) LUT suspension samples, and (D) LUT-BL samples. Data are expressed as means ± SD. * Statistically significant difference from normal control group, ** statistically significant difference from the SAD model group, and # statistically significant difference from LUT suspension group.

