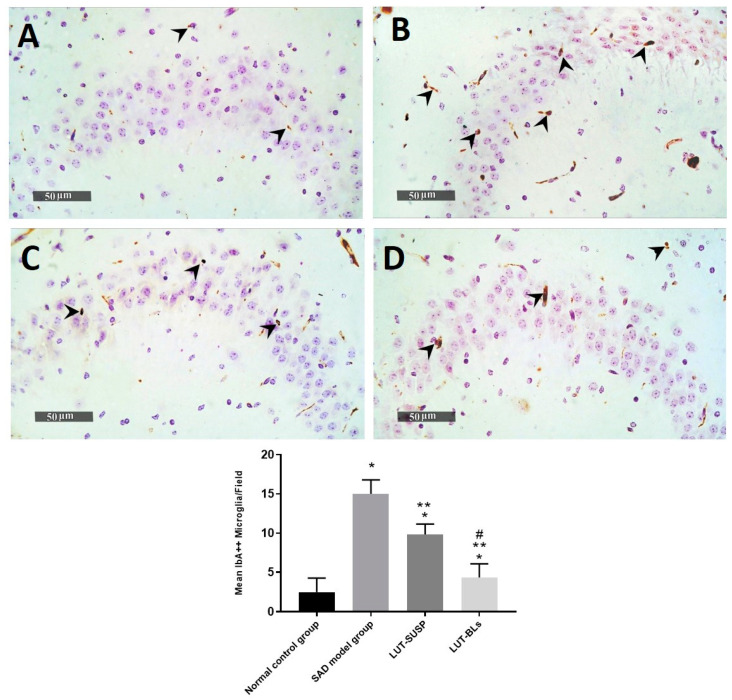
Figure 12.
Hippocampal IbA-1/++ activated microglial cell count expressed as the mean number of IbA-1/++ cells per microscopic field. (A) normal controls, (B) AD model samples, (C) LUT suspension samples, and (D) LUT-BL samples. Data are expressed as means ± SD. * Statistically significant difference from normal control group, ** statistically significant difference from the SAD model group, and # statistically significant difference from LUT suspension group.

