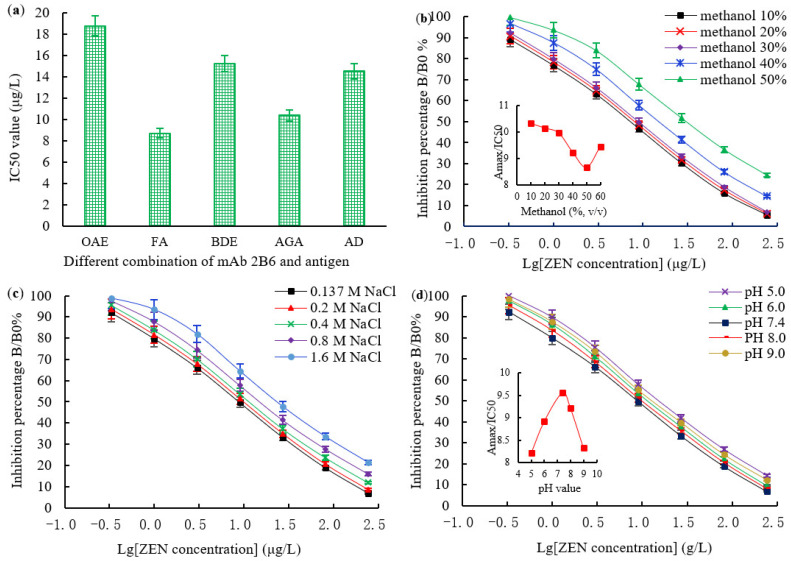
Figure 7.
Optimization of icELISA experimental conditions and establishment of the icELISA standard curve: (a) selection of different combinations of ZEN mAb and antigen; (b) the effects of methanol contents on the sensitivity of the icELISA (insets indicate the fluctuations of Amax/IC50 as a function of methanol contents); (c) the effects of ionic strengths on the sensitivity of the icELISA (insets indicate the fluctuations of Amax/IC50 as a function of ionic strengths); (d) the effects of pH values on the sensitivity of the icELISA (insets indicate the fluctuations of Amax/IC50 as a function of pH values.

