Figure 3.
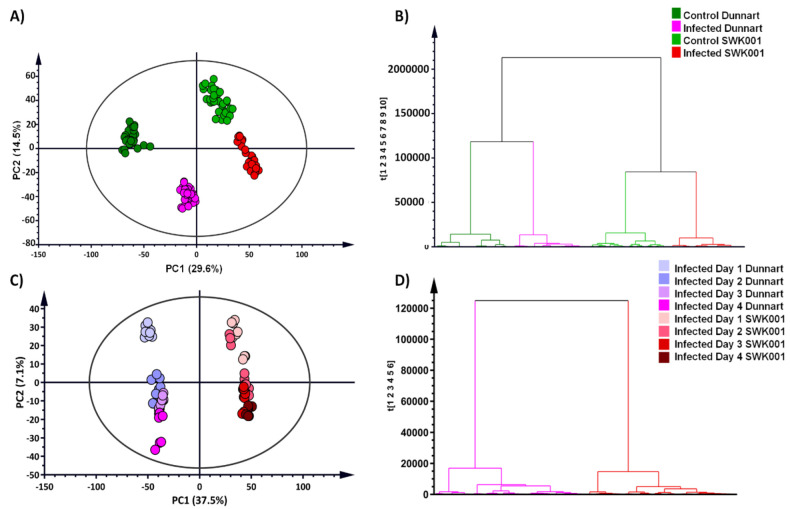
Principal component analysis (PCA) of the two infected oat cultivars with the corresponding hierarchical cluster analysis (HCA) dendrograms. PCA scores plots indicate the clustering and general grouping among the infected and control groups for “Dunnart” (dark green/pink) vs. “SWK001” (light green/red) analysed in ESI(–) mode. (A) PCA scores plots of all the samples showing the infected and control groups as indicated. (C) PCA scores plot illustrating all infected samples from 1–4 d.p.i. for “Dunnart” (left) and “SWK001” (right). (B,D) HCA dendrograms (corresponding to PCA plots (A) and (C), respectively) showing the hierarchical structure of the data, indicating that the control and infected groups for “Dunnart” and “SWK001”, respectively, cluster together and are grouped separately from one another. In (D) the infected groups for “Dunnart” are clustered separately to the left and the infected groups of “SWK001” to the right. The unsupervised modelling tools allowed a comprehensive overview of the data (PCA) and grouped the samples with regard to their treatment-related differences from 1–4 d.p.i. and their natural clustering based on cultivar-dependent variation (HCA).

