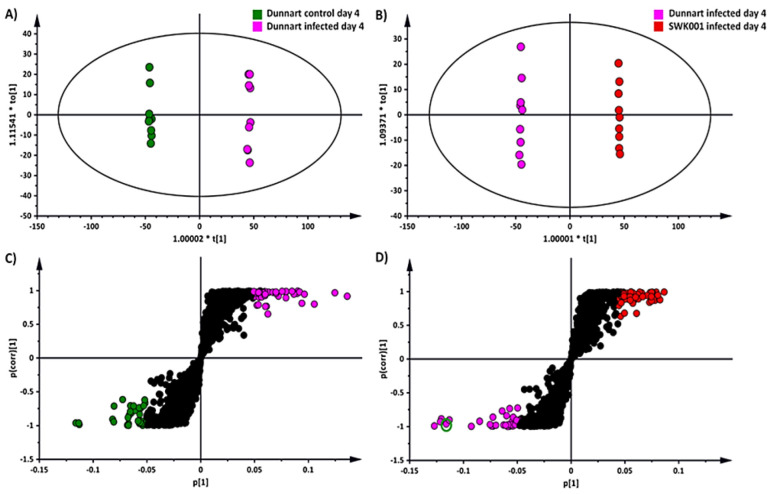
Figure 4.
An OPLS-DA model of the two infected cultivars: “Dunnart” and “SWK001”. (A) An OPLS-DA scores plot summarising the relationship among different datasets to visualise group clustering between the control and infected “Dunnart” groups at 4 d.p.i. based on their leaf-extracted metabolic profiles obtained in ESI(–) MS mode (R2 = 0.999, Q2 = 0.995, CV-ANOVA p-value = 1.89349 × 10⁻¹⁵). (B) OPLS-DA scores plot illustrating the relationship among the infected “SWK001” and “Dunnart” plants at 4 d.p.i. based on their leaf-extracted metabolic profiles obtained in ESI(−) MS mode (R2 = 0.999, Q2 = 0.996, CV-ANOVA p-value = 1.06365 × 10⁻¹⁴). (C) The corresponding OPLS-DA loadings S-plot of (A). The pink and green circles indicate the values situated far out [1] (p > 0.05, <−0.05 and p(corr) >0.5, <−0.5) in the S-plot, representing statistically significant ions that are possible discriminatory variables between the control and infected “Dunnart” groups. (D) The corresponding OPLS-DA loadings S-plot of (B). The pink and red circles indicate the values situated far out [1] (p > 0.05, <−0.05 and p(corr) >0.5, <−0.5) in the S-plot, indicating statistically significant ions that are possible discriminatory variables between the infected “SWK001” and “Dunnart” plants. The green circle indicates the selected variable (avenanthramide A) for which validation models are shown in Figure 5.

