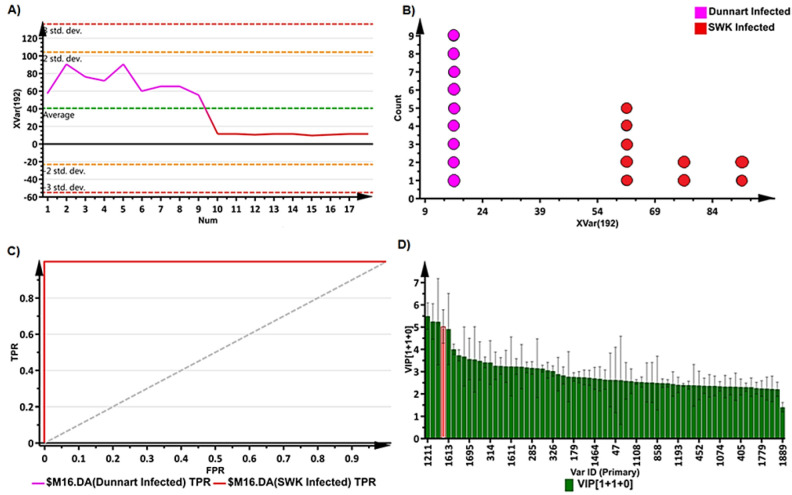
Figure 5.
S-plot and OPLS-DA representative validation models. (A) Variable trend plot illustrating the selected variable, avenanthramide A, that displayed changes among the “Dunnart” and “SWK001” infected groups at 4.d.p.i. This metabolite is illustrated in red on the VIP plot (D) and circled on the S-plot (Figure 4D). (B) Dot plot illustrating strong discrimination between infected groups of the “SWK001” and “Dunnart” cultivars for the selected variable (avenanthramide A) as there is no overlap between the groups. (C) Receiver operator characteristic (ROC) plot separating the infected groups at 4 d.p.i. for the OPLS-DA model (Figure 4B). The ROC graph is a representation of the performance of the binary classifier. As the curves passes through the top left corner, a model with perfect discrimination is confirmed as having 100% sensitivity and 100% specificity. (D) A variable importance for the projection (VIP) plot of Figure 4B, illustrates each variable, its importance and how it contributes to the discrimination of the two groups.

