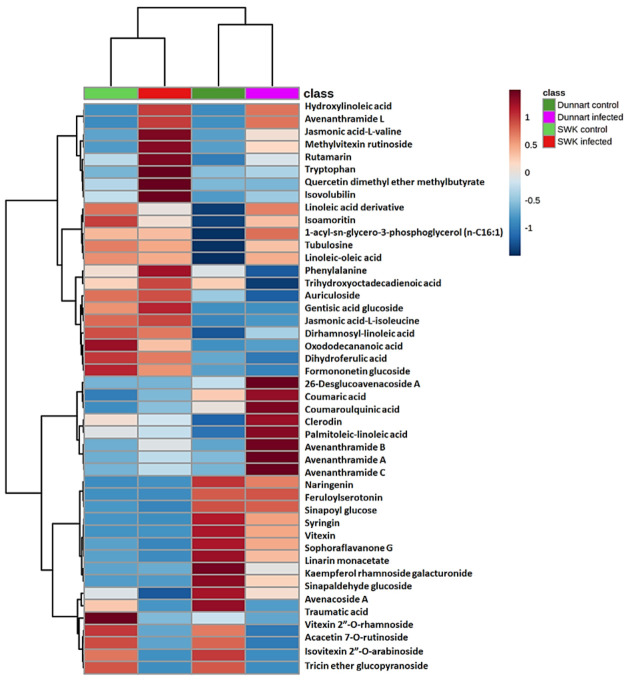
Figure 6.
Heatmap analysis of individual peak intensities of the putatively identified discriminatory metabolites from oat leaves treated with Ps-c. The map was constructed (using the Pearson distance and Ward’s linkage rule) to illustrate infected and control groups of the two respective cultivars, “Dunnart” and “SWK001”. After Pareto-scaling the data, the mean peak intensities of each annotated metabolite are displayed. Higher than average values are shown in brown, while lower values are shown in blue, with each row representing discriminant features and each column representing cultivars and treatment groups, respectively.

