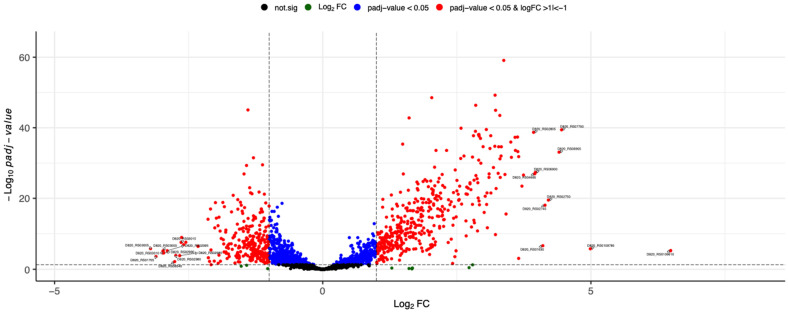
Figure 2.
Volcano plot of differential gene expression of S. mutans treated with CHX versus untreated bacteria. Each point represents the average value of one transcript in five replicate experiments. The expression difference is considered significant for a multiple (FDR-based) adjusted p-value of 0.05 (light grey broken horizontal line). The list of DE genes was then further filtered for biological relevance by filtering on a log2 fold change of ≥1 and ≤−1 (red points, outer blue broken vertical lines). The top 20 DE genes based on log2 fold change are labelled.

