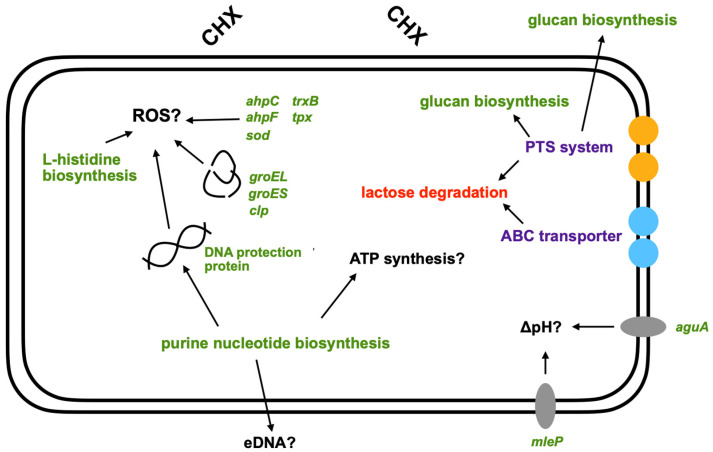
Figure 3.
Schematic representation of a possible stress response in S. mutans to CHX treatment found in this study. Shown are the mechanisms described in the discussion in response to CHX treatment. Green: upregulated; red: downregulated; purple: up- and downregulated. Black arrows represent the links between different mechanisms. ROS: reactive oxygen species; PTS: phosphotransferase system; ABC: ATP-binding cassette; eDNA: extracellular DNA.

