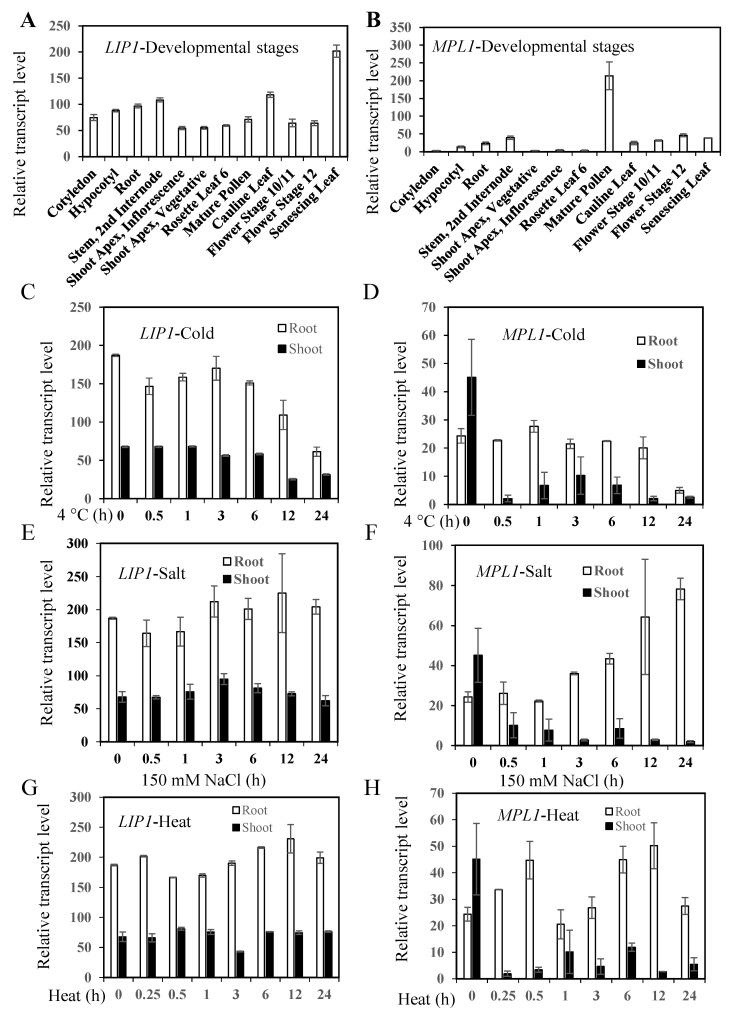
Figure 2.
LIP1 and MPL1 display differential expression patterns in organs and developmental stages and under cold stress. (A,B) Expression profiles of LIP1 (At2g15230) and MPL1 (At5g14180) in different organs and developmental stages of wild-type plants as determined by microarrays [16]. (C,D) Expression profiles of LIP1 and MPL1 under cold stress as determined by microarrays with 13-day-old wild-type seedlings subjected to cold treatments [17]. (E,F) Expression profiles of LIP1 and MPL1 under salt stress as determined by microarrays with 13-day-old wild-type seedlings subjected to cold treatments [17]. (G,H) Expression profiles of LIP1 and MPL1 under salt stress as determined by microarrays with 16-day-old wild-type seedlings subjected to heat stress at 38 °C for 0, 0.25 (+0 h recovery at 25 °C), 0.5 (+0 h recovery at 25 °C), 1 (+0 h recovery at 25 °C), or 3 h (+3 h recovery at 25 °C = 6 h; +9 h recovery at 25 °C = 12 h; +21 h recovery at 25 °C = 24 h) [17]. Data are means ± sd (n = 3).

