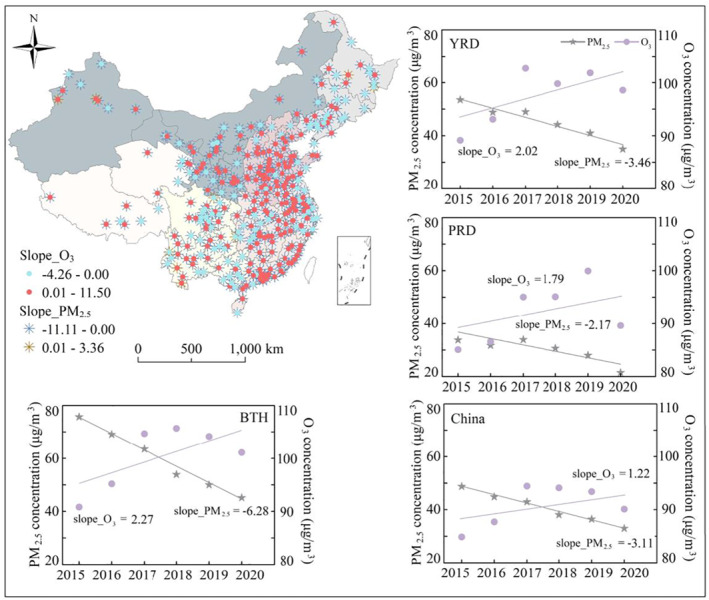
Figure 2.

Spatiotemporal variation trends of the annual mean MDA8 O3 and PM2.5 concentrations from 2015 to 2020 in China. BTH represents Beijing‐Tianjin‐Hebei region, YRD represents Yangtze River Delta, PRD represents Pearl River Delta.

Spatiotemporal variation trends of the annual mean MDA8 O3 and PM2.5 concentrations from 2015 to 2020 in China. BTH represents Beijing‐Tianjin‐Hebei region, YRD represents Yangtze River Delta, PRD represents Pearl River Delta.