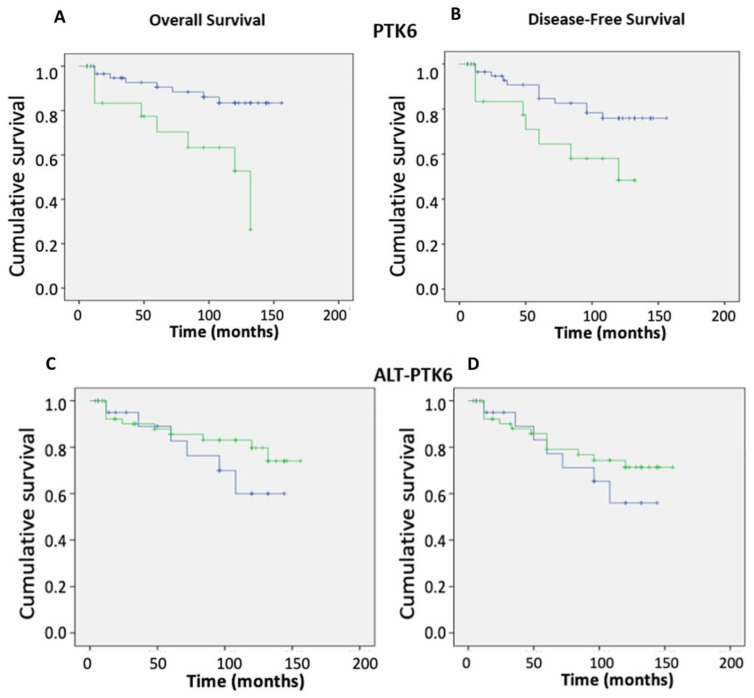
Figure 5.
Effect of ptk6 transcripts on patient outcomes. Ptk6 transcript expression was determined in breast cancer tissue (n = 127) in relation to the normal background tissue (n = 33) using real-time qPCR and correlated with conventional clinic-pathological parameters and clinical outcomes. The Kaplan–Meier curves show high ptk6 expression (green) and low ptk6 (blue) levels in relation to (A) overall and (B) disease-free survival over time, as well as ALT-TPK6 in relation to (C) overall and (D) disease-free survival over time, where high expression is again in green and low expression is in blue. The statistical analysis is shown in the Supplemental Tables S1–S4.

