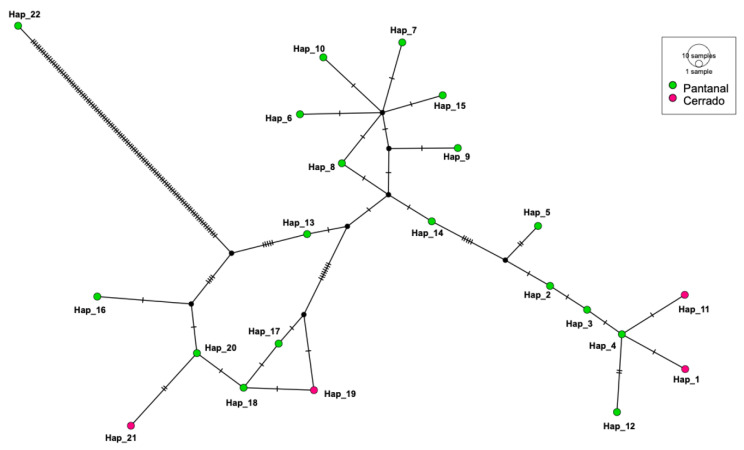
Figure 5.
Genotype diversity among 16S rRNA gene sequences detected herein. Analysis was made using DnaSP6. Inference and graphic representation were made by TCS network method on PopART software. Genotypes in blue were obtained from samples from tapirs in Pantanal regions meanwhile genotypes in green were obtained from samples from tapirs in Cerrado regions.

