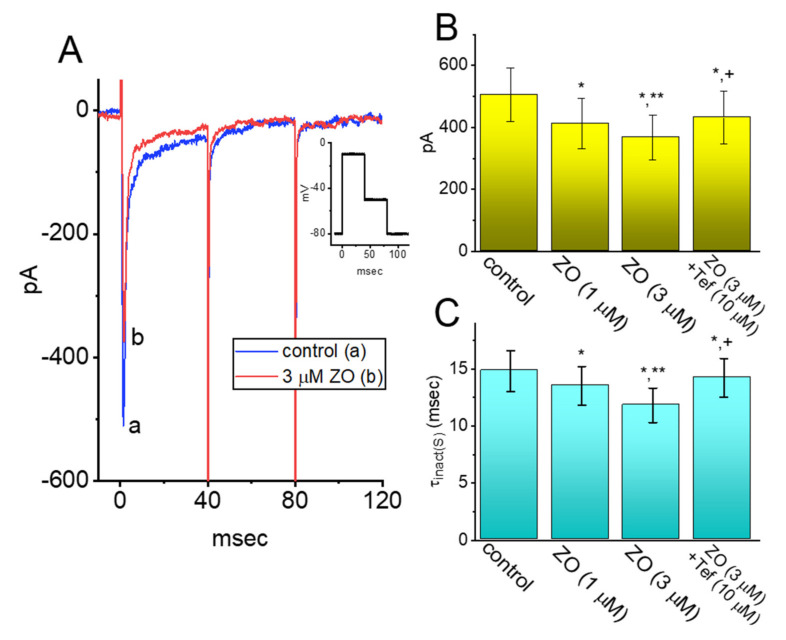
Figure 8.
Inhibitory effect of ZO on INa on mHippoE-14 hippocampal neurons. (A) Representative current traces obtained in the absence (a) or presence of 1 μM ZO (b). The inset shows the pulse protocol used in this study. Panel (B,C) are summary bar graphs demonstrating the effects of ZO and ZO plus Tef on the peak amplitude or τinact(S) of depolarization-activated INa, respectively (mean ± SEM; n = 7 for each bar). * Significantly different from the control (p < 0.05), ** significantly different from the 1 μM ZO-alone group (p < 0.05), and + significantly different from the 3 μM ZO-alone group (p < 0.05). Panel (A): (One-way ANOVA, F(3,24) = 3.351, p = 0.03) and panel (B): (One-way ANOVA, F(3,24) = 4.012, p = 0.02).

