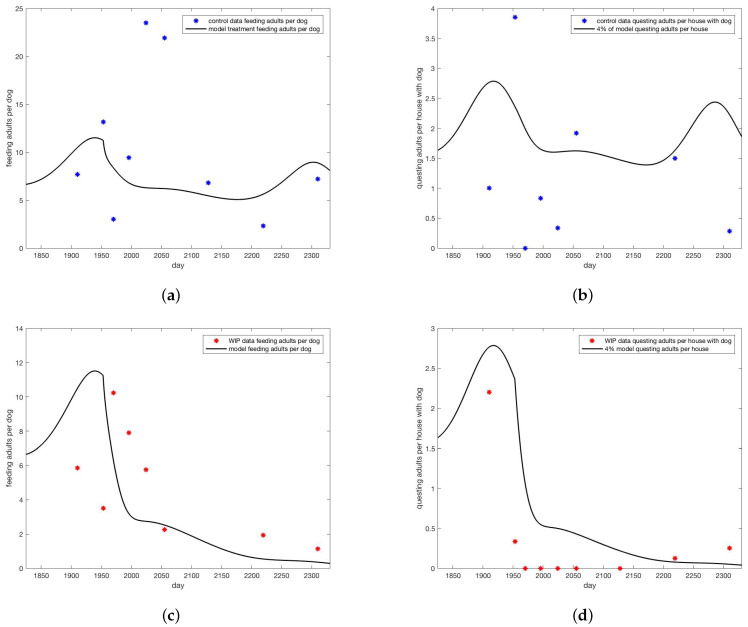
Figure 4.
Model versus data for (a) adults on dogs for control and (b) on walls of houses with dogs for control. Data are blue dots, model trajectory is the black curve. For the data 80% coverage in collars was noted and no wall treatment. For the model, 8% coverage of dog collars () was used and no wall treatment (). Model versus data for (c) adults on dogs for WIP full height insecticidal paint. Data are red dots, model trajectory is the black curve. (d) on walls of houses with dogs for WIP full height insecticidal paint. Data are red dots, model trajectory is the black curve. For the data 80% coverage in collars was noted and 15% wall treatment. For the model, 8% coverage of dog collars () was used and 3.75% wall treatment (). Note that for counts of ticks on walls, 4% of model value was shown for visual ease.

