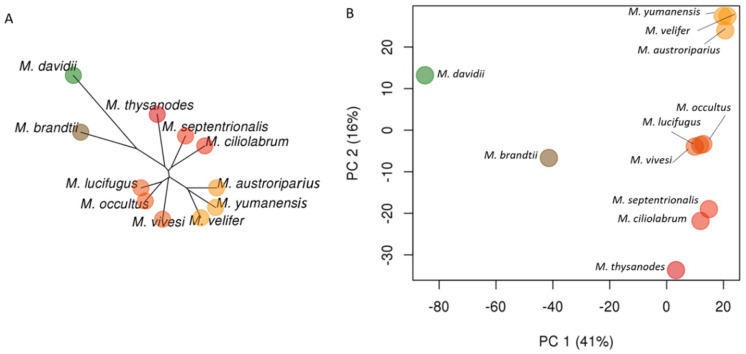
Figure 3.
Genetic structure within Myotis as revealed by 10,595 orthologous Ves insertion events. (A) Unrooted neighbor-joining tree based on Ves insertions. (B) Scatterplot of the first two principal components (PC1 and PC2) illustrating differences among Myotis genomes. Percentages indicate percent of variation explained by each principal component shown. Colors in both figures are determined by PC values.

