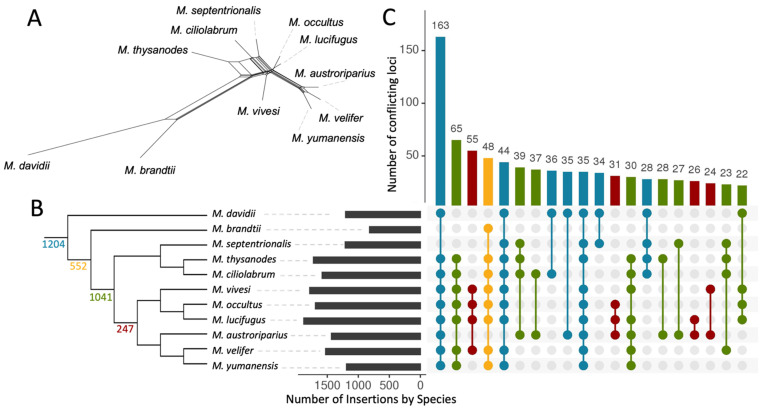
Figure 4.
Visualizations of phylogenetic discordance among Myotis inferred from polymorphic Ves insertions. (A) Unrooted median joining network tree generated from all 10,595 loci. (B) Majority rule consensus tree illustrating the distribution of discordant signals in the dataset. Discordant Ves insertions (2+ state changes) are considered a phylogenetic signal for the common ancestor for all taxa carrying the insertions. Counts on the tree indicate the number of synapomorphies coalescing at that node. For nodes without counts, all insertions within that clade alone had fewer than 2 state changes and did not qualify as discordant. The colors and order of species is the same in B and C. (C) Characterization of 3044 discordant insertions. The black bars on the left show the number of discordant insertions present in each species. The dot matrix indicates the synapomorphic patterns, with each pattern represented by a vertical line with dots indicating presence of the insertion in that species. Colors in the dot matrix correspond to the node of coalescence for that insertion in B. The y-axis above gives a count of times that pattern occurred among all 3044 discordant loci. Only the top 20 most prevalent patterns are shown on this graph. See text for additional information.

