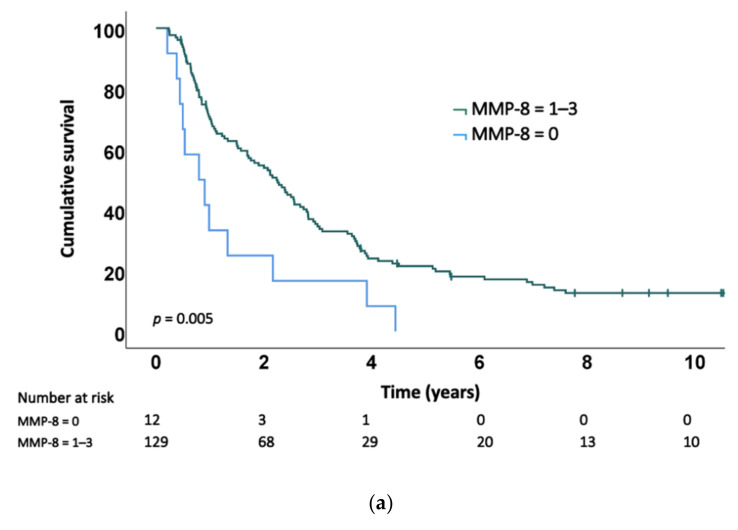
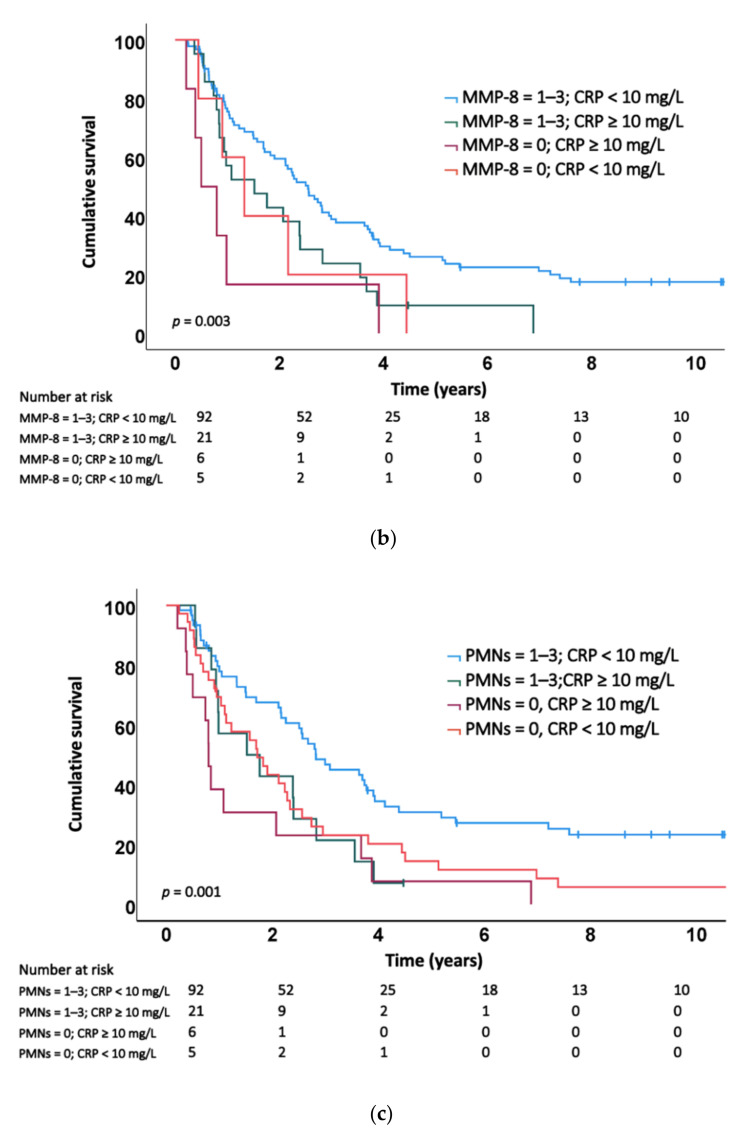
Figure 3.
Kaplan–Meier curves. (a) Survival in all patients, grouped by matrix metalloproteinase 8 (MMP-8) expression in cancer cells (p = 0.005); (b) survival in all patients, grouped by MMP-8 expression in cancer cells and plasma C-reactive protein (CRP) level (p = 0.003); (c) survival in all patients, grouped by MMP-8 positive polymorphonuclear cell (PMN) presence in the tumour and plasma CRP level (p = 0.001).


