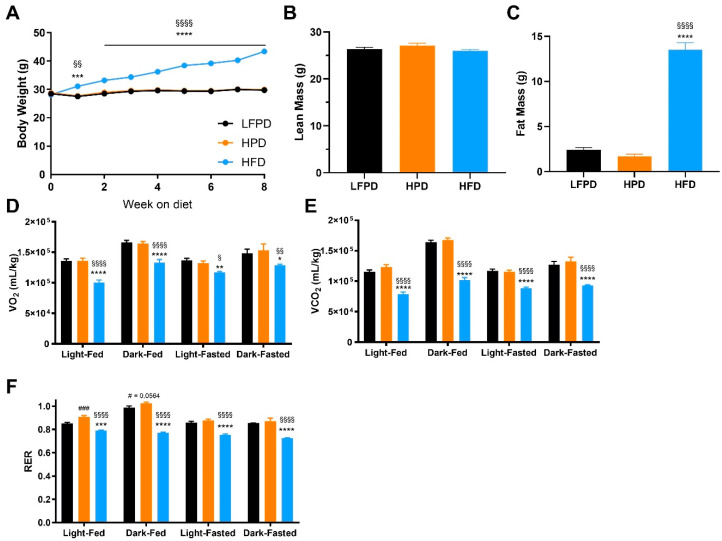
Figure 1.
Six weeks of HFD impaired glucose metabolism. (A) Body weight, (B) Total lean mass, (C) Total fat mass, (D) Oxygen consumption (VO2), (E) Carbon dioxide production (VCO2), and (F) Respiratory Exchange Ratio after 6 weeks of diet intervention. N = 14–30 per group for (A–C), n = 7–10 per group for (D–F). One or two-way ANOVA were used with Tukey’s multiple comparison test (* p < 0.05, ** p < 0.01, *** p < 0.001, **** p < 0.0001 LFPD vs. HFD, § p < 0.05, §§ p < 0.01, §§§§ p < 0.0001 HPD vs. HFD, # p < 0.05, ### p < 0.001 LFPD vs. HPD). Data are expressed as the mean ± SEM.

