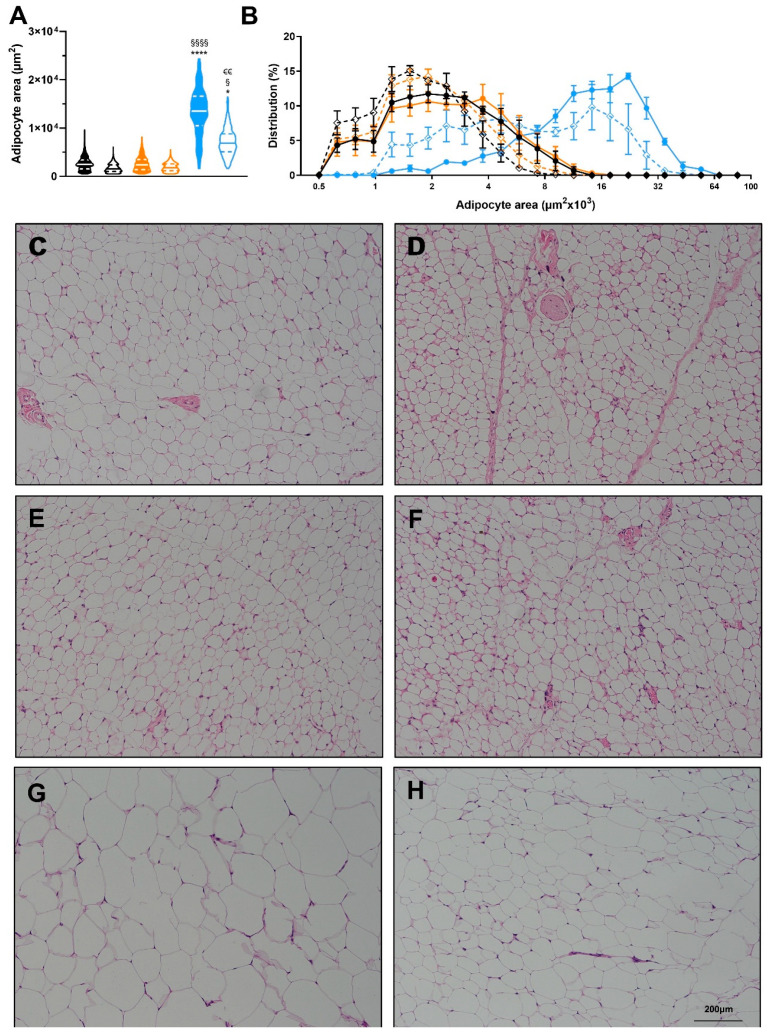
Figure 5.
Effects of diet and exercise on adipocyte size. (A) Average adipocyte area of scWAT, (B) Frequency distribution of adipocyte area of scWAT. Representative histology images for (C) LFPD-Sed, (D) LFPD-Ex, (E) HPD-Sed, (F) HPD-Ex, (G) HFD-Sed and (H) HFD-Ex. N = 3–4 per group). Nested one-way ANOVA was used with Tukey’s multiple comparison test in (A). One or two-way ANOVA were used with Tukey’s multiple comparison test in (B). (* p < 0.05, **** p < 0.0001 LFPD vs. HFD, § p < 0.05, §§§§ p < 0.0001 HPD vs. HFD, €€ p < 0.01 Sedentary vs. Exercise). Data are expressed as the mean ± SEM. Violin plot is shown as min to max with median and first and third quartiles.

