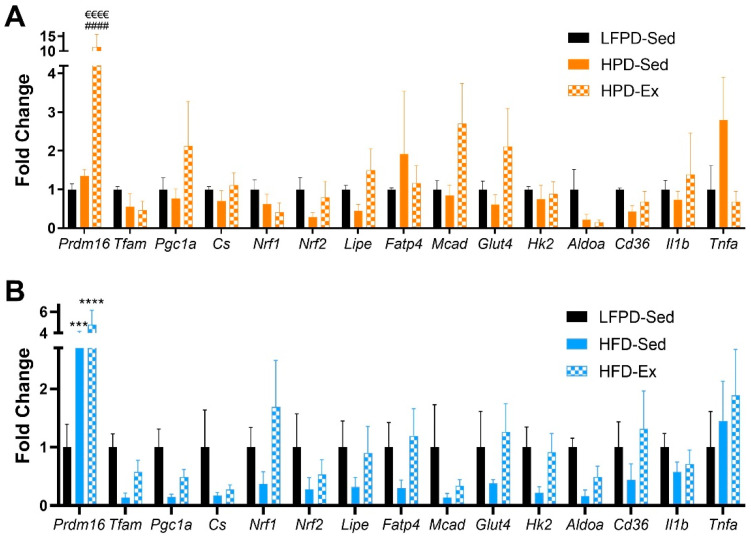
Figure 6.
Exercise affects expression of metabolic and inflammatory genes in scWAT. (A,B) Gene expression data of scWAT (n = 3–7 per group). One-way ANOVA was used with Tukey’s multiple comparison test. (*** p < 0.001, **** p < 0.0001 LFPD vs. HFD, HPD vs. HFD, #### p < 0.0001 LFPD vs. HPD, €€€€ p < 0.0001 Sedentary vs. Exercise). Data are expressed as the mean ± SEM.

