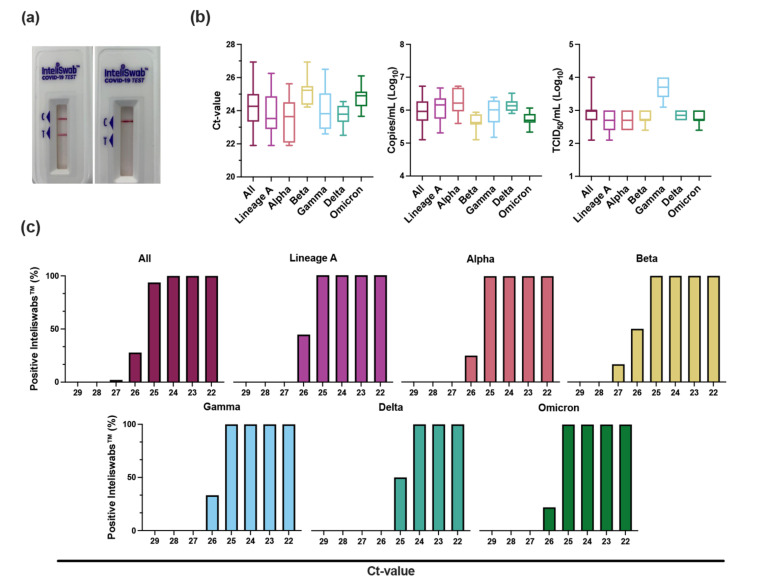
Figure 1.
InteliSwab™ Test detection ability for SARS-CoV-2 variants. Cell culture stocks of the variants were serially diluted, and viral load was measured by gRNA qRT-PCR. (a) Comparison of a positive InteliSwab™ Test (left) and a negative InteliSwab™ Test (right). (b) Box plots displaying the distribution of positive InteliSwab™ Tests across the 6 variants compared to the Ct values, RNA copies/mL, and TCID50/mL. The positive InteliSwabs™ are from the 2-fold dilution series for each variant (from left to right, N = 145, 31, 27, 19, 30, 18, and 20). Shown is the median, minimum, and maximum. (c) Bar charts representing the percentage of positive InteliSwab™ Tests compared to Ct values. Initial Ct values were rounded to the nearest whole number.

