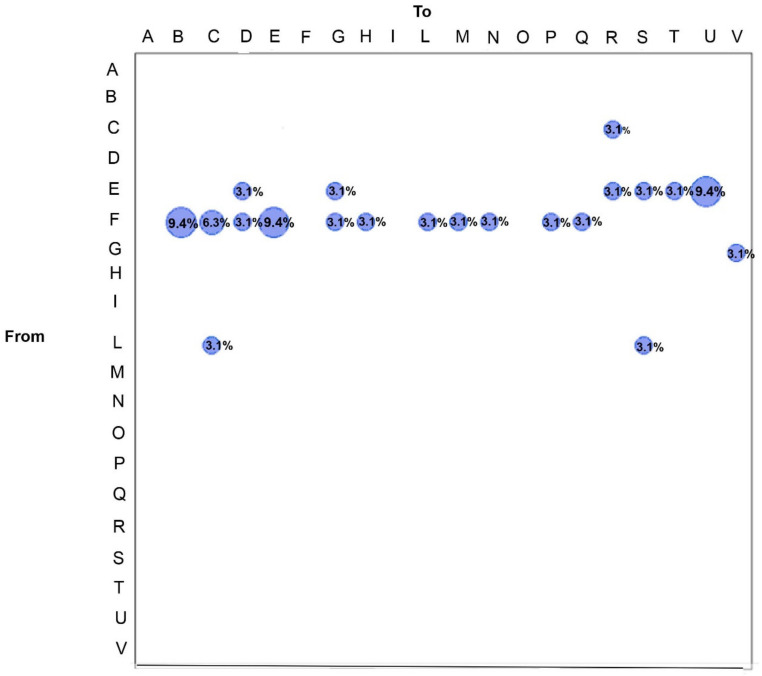
Figure 3.
Maximum parsimony migration patterns of SARS-CoV-2 Italian genomes to/from different regions of the country (A, Basilicata; B, Friuli-Venezia Giulia; C, Lazio; D, Molise; E, Abruzzo; F, Lombardy; G, Veneto; H, Tuscany; I, Sicily; L, Campania; M, Marche; N, AP of Trento; O, Emilia Romagna; P, Apulia; Q, Piedmont; R, Umbria; S, Calabria; T, Sardinia; U, Valle d’Aosta; V, AP of Bolzano). The bubblegram shows the frequency of gene flow (migrations) to/from different regions, as the percentage of the total observed migrations estimated from the tree with a modified version of the Slatkin and Maddison test. The surface of each circle is proportional to the percentage of observed migrations stated within the circle.

