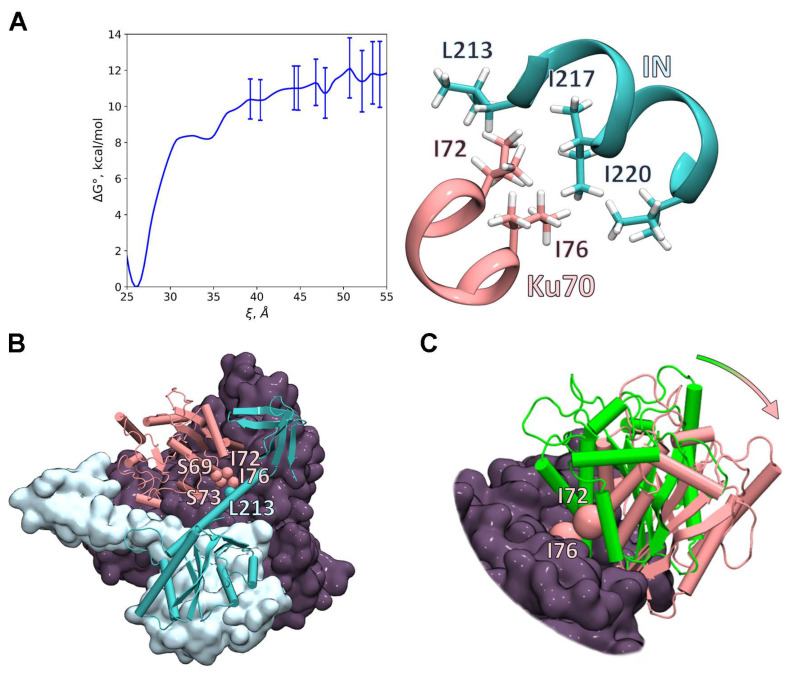
Figure 3.
Three-dimensional model of the Ku70/IN complex. (A) Gibbs energy profile of the N-terminal domain of Ku70 and IN binding. The error bars are calculated using umbrella integration approach. The inset demonstrates the hydrophobic binding motif of the so-called “leucine zipper”. Ku70 and IN carbon atoms are colored pink and cyan, respectively, and hydrogen atoms are white. (B) Calculated structure of the Ku70/Ku80 heterodimer and IN dimer complex. IN dimer is shown in light blue: the monomer that interacts with the N-terminal domain (up to 250th residue) of Ku70 is shown in cartoon representation. The dark isosurface is the Ku70/Ku80 heterodimer, except the N-terminal domain of the Ku70, which is shown in pink cartoon representation. (C) Alignment of the crystal structure of Ku70/Ku80 heterodimer (PDB ID: 1JEQ [33]) and the calculated structure. The N-terminal domain of Ku70 from the PDB ID: 1JEQ is shown in green. The arrow shows the rotation direction of the N-terminal Ku70 domain.

