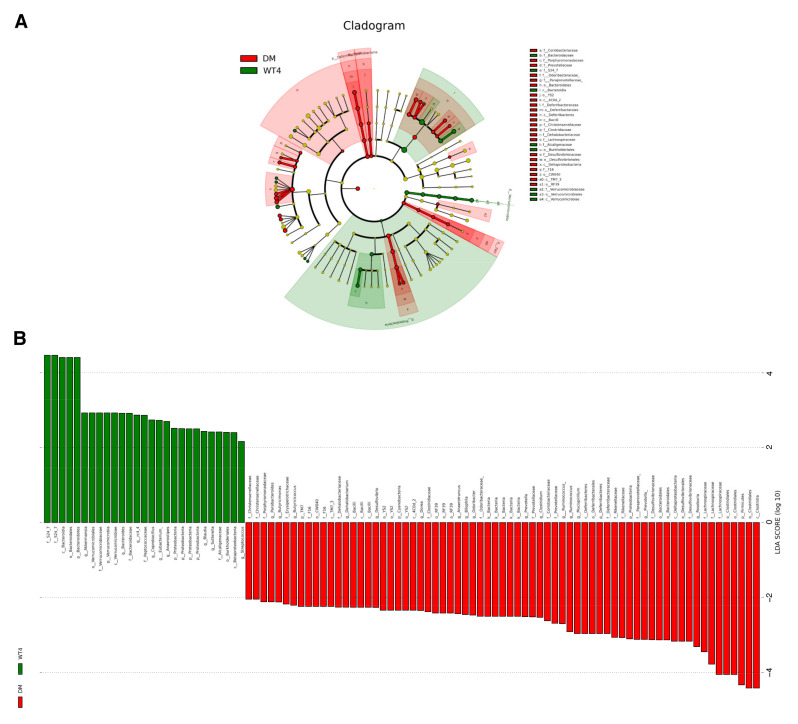
Figure 6.
Taxonomic differences of fecal microbiota between db/db and WT mice. (A) A cladogram reporting the differences which were represented in the color of the most abundant class between the two groups of mice. Red indicates db/db mice, green wt mice, and yellow non-significant. The diameter of each circle is proportional to the relative taxon’s abundance. (B) The histogram of linear discriminant analysis (LDA) scores. The length of each bar represents the impact size of the bacterial taxa differentially abundant.

