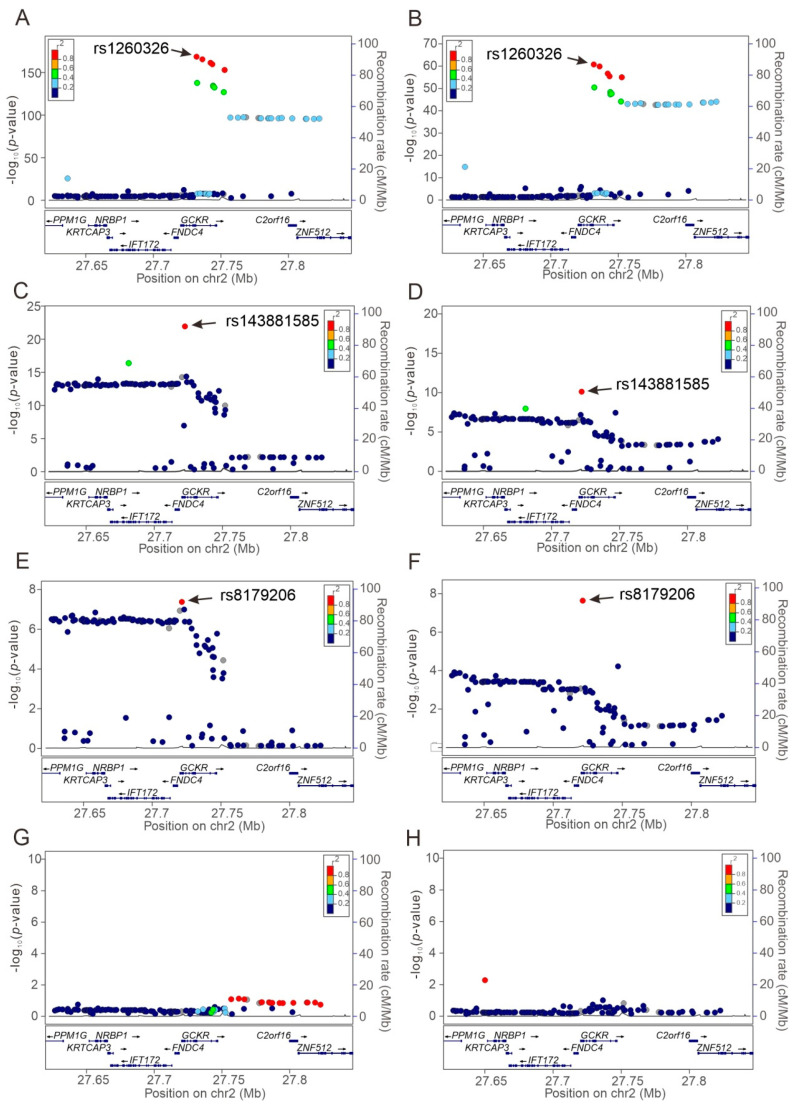
Figure 2.
Regional plot associations of the GCKR gene region for the serum triglyceride and albumin levels. Regional plot associations are shown without (A,B) or with serial conditional analysis after further adjustment for rs1260326 (C,D), rs143881585 (E,F), and rs8179206 (G,H) genotypes. Association analyses were performed for serum triglyceride (A,C,E,G) and albumin (B,D,F,H) levels. GCKR, glucokinase regulator.

