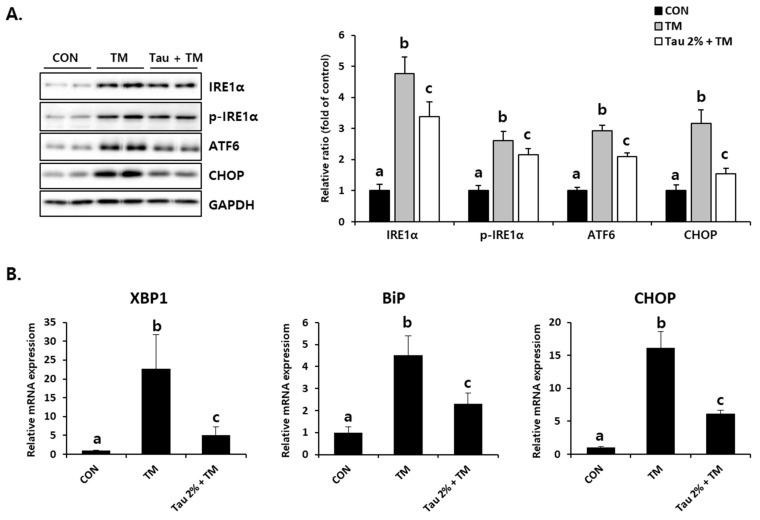
Figure 2.
Effect of taurine on TM-induced ER stress in the livers. (A) Protein levels of IRE1α, phospho-IRE1α, ATF6, and CHOP (Whole blot images can be found in Figure S1). (B) XBP1, BiP, and CHOP mRNA expressions. Values are represented as the mean ± SD. Values with different letters (a, b, c) are significantly different from one another at p < 0.05 (one-way ANOVA followed by Newman-Keuls test).

