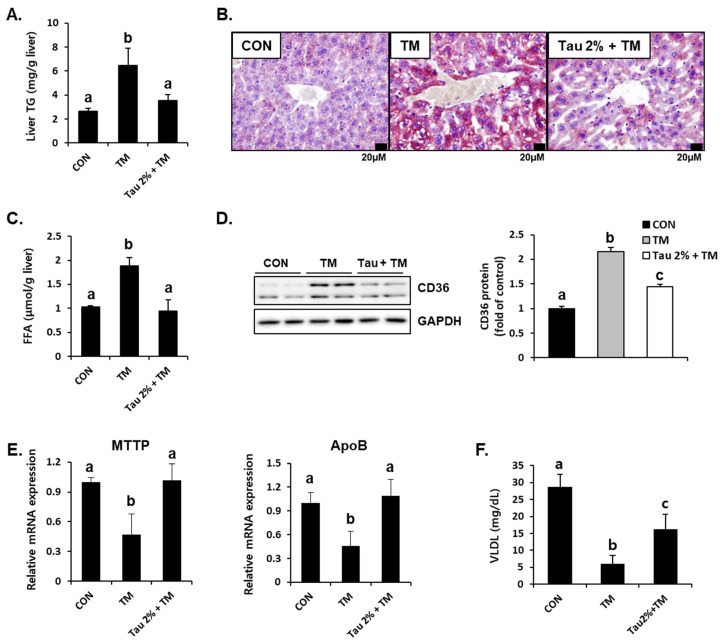
Figure 3.
Effect of taurine on tunicamycin (TM)-induced lipid accumulation and the protein level of lipid transporter in the livers. (A) Levels of triglyceride (TG) in the homogenates of the liver. (B) Oil Red O staining in the liver. (C) Hepatic free fatty acid level. (D) Hepatic protein level of CD36 in the livers was determined by western blot analysis, and the levels of protein was normalized to that of GAPDH (Whole blot images can be found in Figure S2). (E) mRNA expression of microsomal triglyceride transfer protein (MTTP) and apolipoprotein B (ApoB). (F) Blood very-low-density lipoprotein (VLDL) level. Values are represented as the mean ± SD. Values with different letters (a, b, c) are significantly different from one another at p < 0.05 (one-way ANOVA followed by Newman-Keuls test).

