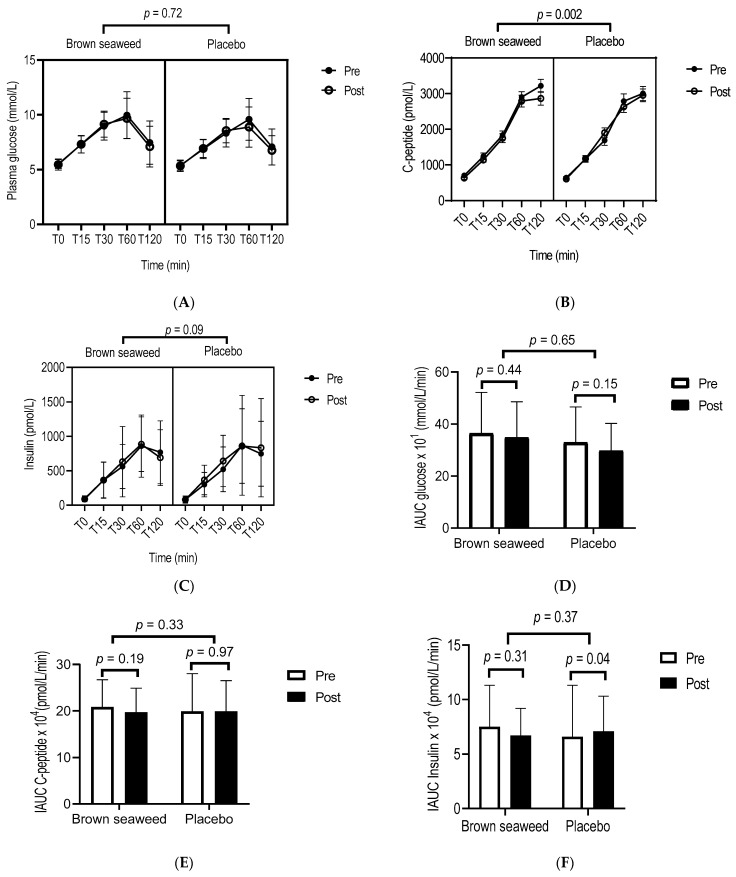
Figure 2.
Glucose, insulin and C-peptide concentrations and IAUC during OGTT. □ Pre-intervention (at the beginning of the 12-week trial). ■ Post-intervention (at the end of the 12-week trial). Repeated measures ANOVA highlighting significant differences in the concentrations of glucose (A), C-peptide (B), and insulin (C), and in their respective IAUCs (D–F) over time between the brown seaweed and the placebo groups. A mixed model for repeated-measures ANOVA with three factors (treatment, OGTT time points, post-pre phase) (A–C) and with two factors (treatment, post-pre phase) (D–F) was performed. Incremental area under the curve (IAUC) for glucose, insulin, and C-peptide during the 2 h-OGTT was calculated from the trapezoidal rule and fasting baseline values. Values are means with standard deviations represented by vertical bars. n = 56 for glucose, n = 44 for insulin, and n = 56 for C-peptide.

