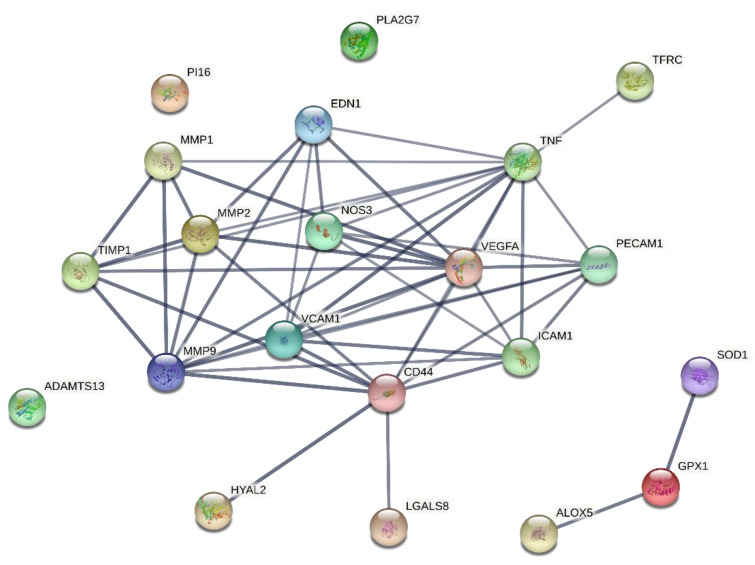
Figure 2.
Protein–protein association network visualized by STRING. Each node represents all the proteins produced by a single, protein-coding gene locus, while each edge represents the number of protein–protein associations. Only interactions with a high confidence score of ≥0.7 are shown. The color saturation of the edges represents the confidence score of the functional association [17]. ADAMTS13 = ADAM Metallopeptidase with Thrombospondin Type 1 Motif 13; ALOX5 = Arachidonate 5-Lipoxygenase; CD31 = Platelet And Endothelial Cell Adhesion Molecule 1; CD44 = Hyaluronan receptor; EDN1 = Endothelin 1; GPX1 = Glutathione peroxidase 1; HYAL2 = Hyaluronidase 2; ICAM1 = Intercellular Adhesion Molecule 1; LGALS8 = Galectin 8; MMP1 = Matrix metalloproteinase 1; MMP2 = Matrix metalloproteinase 2; MMP9 = Matrix metalloproteinase 9; NOS3 = Endothelial nitric oxide synthase; PI16 = Peptidase Inhibitor 16; PLA2G7 = Phospholipase A2 Group VII; SOD1 = Superoxide dismutase 1; TFRC = Transferrin Receptor; TIMP1 = TIMP Metallopeptidase Inhibitor 1; TNF = Tumor Necrosis Factor; VCAM1 = Vascular cell adhesion molecule 1; VEGFA = Vascular endothelial growth factor A.

