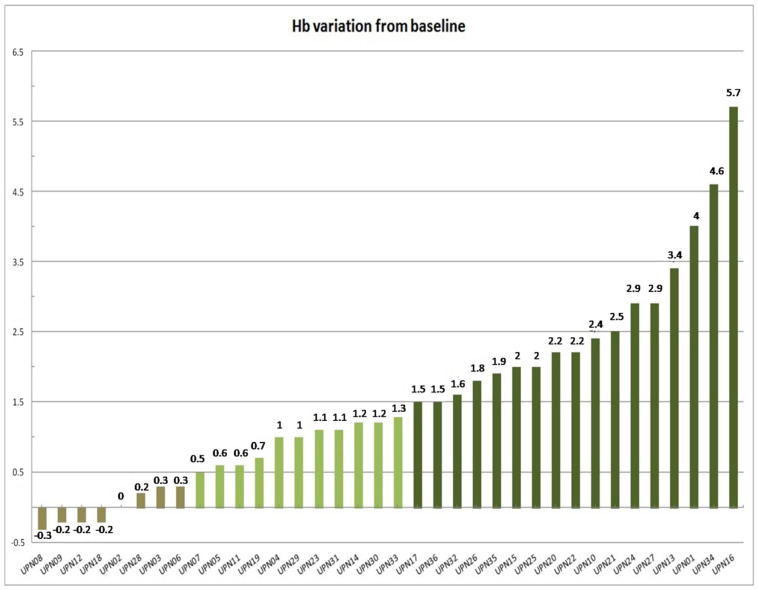
Figure 1.
Waterfall plot indicating the Hb variation at 8th week from treatment start. Dark green indicates patients responding (Hb greater than 1.5 g/dL) at this time. Light green indicates patients who showed a Hb increase of at least 0.5 g/dL (but less than 1.5 g/dL). Brownish green indicates patients who showed Hb reduction or less than a 0.5 g/dL raise.

