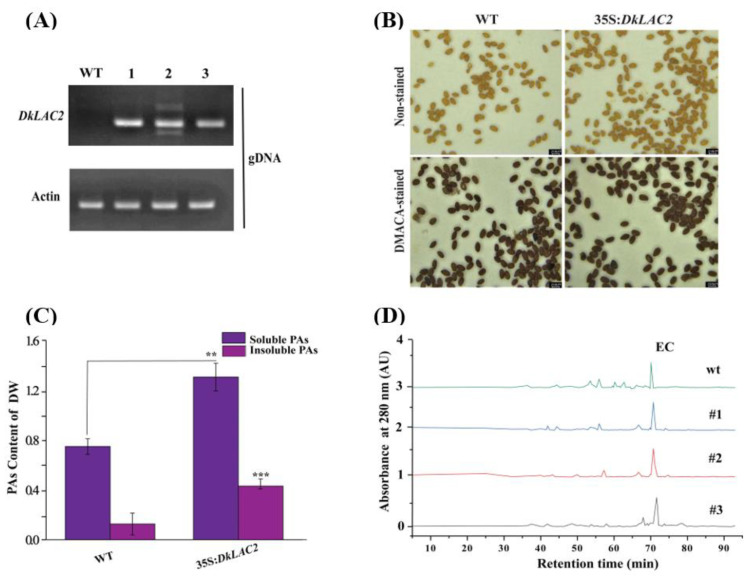
Figure 6.
Functional analysis of DkLAC2 via transformation in Arabidopsis. (A) Semi-quantification of DkLAC2 in WT Arabidopsis and transgenic lines. (B) Seed coat pigmentation before and after staining colorations by DMACA reactions comparison between wild-type Arabidopsis seeds and T1 Arabidopsis transgenic lines derived from DkLAC2 transformation. Bars = 250 µm. (C) PAs content of WT and 2 × 35S:DkLAC2 Arabidopsis transgenic plants seeds. (D) HPLC analysis of PAs monomers in Arabidopsis transgenic line compared to WT. Data represent the mean of three biological replicates, and error bars represent the standard deviation of three replicates (n = 3). Asterisks above the bars indicate values determined by Student’s t-test to be significantly different from the control (** p < 0.01, *** p < 0.001).

