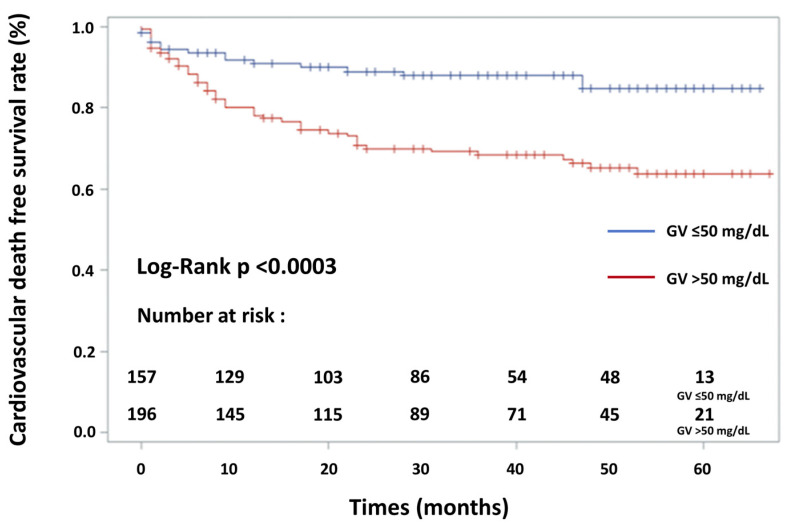
Figure 3.
Kaplan–Meier cardiovascular death-free survival curves for the patients in two groups according to glycaemic variability (GV). Pairwise comparisons between patient groups are given. Survival rate was significantly lower in patients with high GV (log-rank test, p < 0.0003—solid blue line: GV ≤ 50 mg/dL; solid red line: GV > 50 mg/dL).

