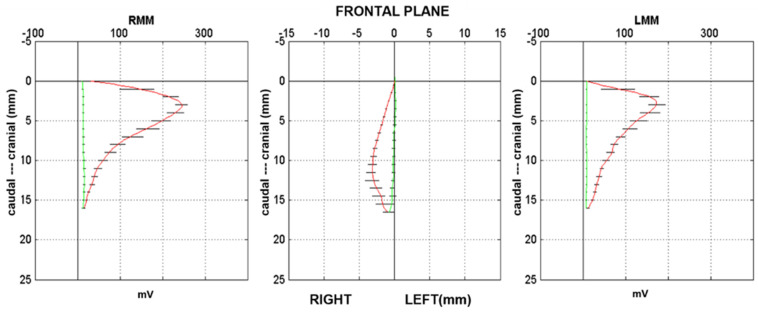
Figure 2.
The masticatory kinematic pattern in the frontal plane (central plot), and the EMG envelope of the right and left masseter, plotted versus the vertical jaw displacement of a patient with deep bite malocclusion, during chewing of a hard bolus on the right side. The solid line, green for the opening pattern and red for the closing pattern, represents the average chewing cycle of 3 trials, lasting 10 s each; the black lines represent the standard deviation over the average cycle. Top: image of the deep bite malocclusion of one of the patients. Note the very high activity and the narrow pattern with very low standard deviation, especially in the occlusal phase of the closing pattern, indicating that the dental malocclusion and the hyperactivation of the masseter muscles restrict the mandibular movements. This is a functional malocclusion; the teeth position is the consequence of the cranial and muscular structure. mV, millivolt; RMM, right masseter muscle; LMM, left masseter muscle.

