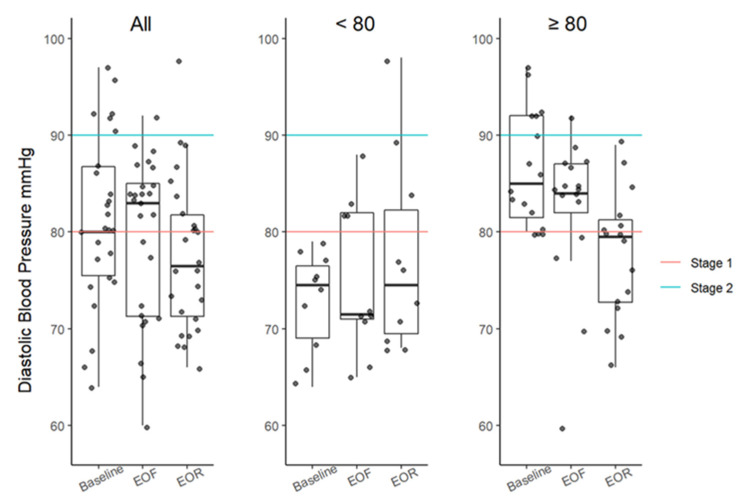
Figure 4.
DBP boxplots at baseline, EOF, and EOR. Data further categorized based on high threshold (≥80 mmHg; red line). DBP between 80 and 89 mmHg is considered stage 1 hypertension. SBP ≥90 mmHg (blue line) is considered stage 2 hypertension. Boxplots represent the minimum value, first (lower) and third (upper) quartiles, the median, and the maximum value. EOF, end of fast; EOR, end of refeed; DBP, diastolic blood pressure; mmHg, millimeters of mercury.

