Figure 6.
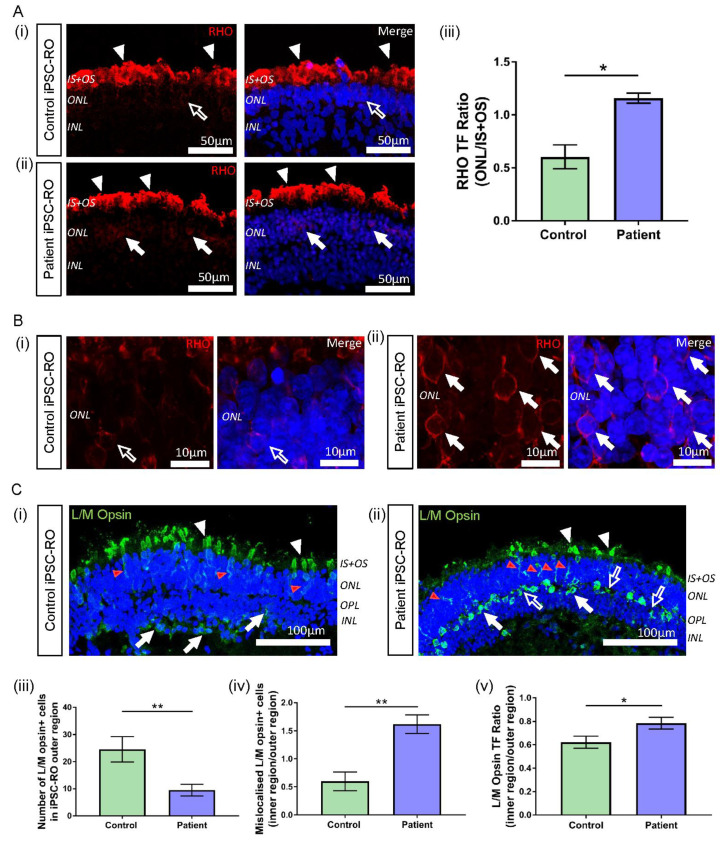
Rhodopsin and L/M opsin abnormalities in RPGR c.1415 − 9A>G iPSC-ROs. (A) (i) Rhodopsin staining (red) in control iPSC-ROs showed protein localization to the IS + OS region of the rod photoreceptor cells (white arrowheads), with minimal staining seen in the soma of the cells (white arrow outline). (ii) In patient iPSC-ROs, rhodopsin staining was also seen in the IS + OS region of the rod photoreceptor cells (white arrowheads), as well as in the soma (white arrows). (Control = Control 1, Patient = Clone 1). (iii) TF expressed as a ratio (ONL/IS + OS) indicated more staining present in the soma of rod photoreceptor cells in the ONL region in patient iPSC-ROs compared with controls (unpaired t-test, * p < 0.05, SEM from n = 3 independent iPSC-ROs per line). (Control = Control 1; Patient = Clones 1 and 2). (B) High resolution 63x Airyscan images of the ONL in (i) control iPSC-ROs demonstrated minimal rhodopsin staining at the cell soma (white arrow outline) compared to (ii) patient iPSC-ROs, where rhodopsin staining was more evident around the cell soma (white arrows). (Control = Control 1, Patient = Clone 1). (C) (i) The expression of L/M opsin (green) was seen in the control iPSC-RO photoreceptor IS + OS (white arrowheads) and ONL (red arrowheads), with some staining in the OPL and INL (white arrows). (ii) This pattern of staining was also seen in patient iPSC-RO IS + OS (white arrowheads) and ONL (red arrowheads), with L/M opsin staining also seen in the OPL and INL (white arrows). Additional L/M opsin staining was seen in the OPL that was outside the soma staining (white arrow outlines). (Control = Control 2; Patient = Clone 2). (iii) The quantification of L/M opsin+ cells in the outer region (IS + OS and ONL) of control and patient iPSC-ROs showed a decrease in cone photoreceptor cells in the patient iPSC-ROs (unpaired t-test, ** p < 0.01, SEM from n = 3–5 independent iPSC-ROs per line). (Control = Controls 1 and 2; Patient = Clones 1 and 2). (iv) The number of L/M opsin+ cone photoreceptor cells in the outer region (IS + OS and ONL) of control and patient iPSC-ROs compared against the number of L/M opsin+ cone photoreceptors mislocalised to the inner regions (OPL and INL) of the iPSC-ROs indicated more mislocalised cone photoreceptor cells in the patient iPSC-ROs (unpaired t-test, ** p < 0.01, SEM from n = 3–5 independent iPSC-ROs). (v) TF expressed as a ratio of inner/outer (INL + OPL/IS + OS + ONL) regions indicated more L/M opsin protein present in the OPL and INL of patient iPSC-ROs compared to controls (unpaired t-test, * p < 0.05, SEM from n = 3–5 independent iPSC-ROs per line). (Control = Controls 1 and 2; Patient = Clones 1 and 2).

