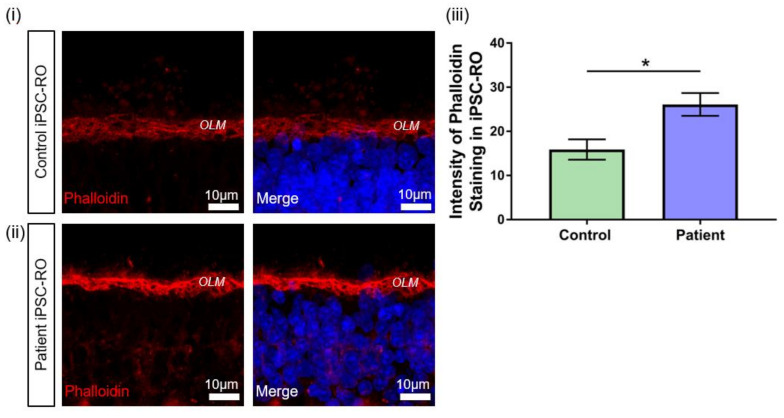
Figure 7.
F-actin abnormalities in RPGR c.1415 − 9A>G iPSC-ROs. (i) Phalloidin expression in a 30-week-old (i) control and (ii) patient iPSC-ROs showed high intensity staining of phalloidin present in the control and patient iPSC-ROs at the OLM. (Control = Control 1, Patient = Clone 2). (iii) Pixel intensity showed that phalloidin staining was more intense in the patient iPSC-ROs, indicating an overexpression of F-actin in patient iPSC-ROs (paired t-test, * p < 0.05, SEM from n = 4 independent iPSC-ROs per line) compared to control iPSC-ROs.

