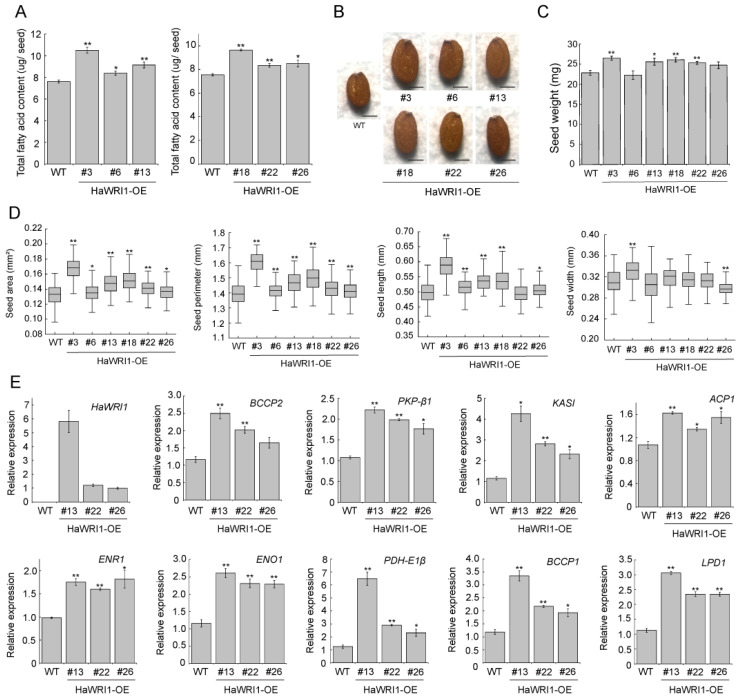
Figure 4.
Functional analysis of transgenic Arabidopsis overexpressing HaWRI1 (HaWRI1-OE). (A) Fatty acid content of seeds of Arabidopsis HaWRI1-OE lines. Results are shown as means ± SE (n = 3–4). (B) Mature dry seeds of WT and HaWRI1-OE lines. Scale bar is 200 μM. (C) Quantitative analysis of seed mass WT and HaWRI1-OE lines. Seed mass was attained by measuring 100 seeds per sample, and results are shown as means ± SE (n = 4–5). (D) Quantitative analysis of seed size of WT and HaWRI1-OE lines. Seed size is denoted by seed area, perimeter, length, and width with box plots displaying medians (lines), interquartile ranges (boxes) and 1.5× interquartile ranges (whiskers) of WT and HaWRI1-OE lines (n = 100). “*” and “**” indicate significant differences (p < 0.05 and p < 0.01, respectively, Student’s t-test) between WT and HaWRI1-OE lines. (E) Pooled siliques (10 DAF) from WT and HaWRI1-OE lines were used for the assay. Transcript levels of various WRI1 target genes (BCCP2, PKP-β1, ACP1, KASI, ENR1, ENO1, PDH-E1β, LPD1, BCCP1) were measured by qRT-PCR. Results are shown as means ± SE (n = 3). “*” and “**” indicate significant differences (p < 0.05 and p < 0.01, respectively, Student’s t-test) between WT and HaWRI1-OE lines in terms of expression of WRI1 target genes.

