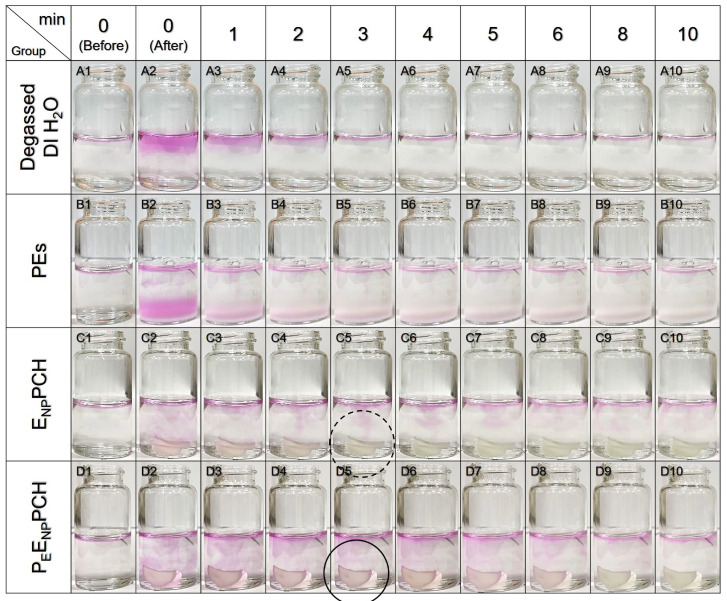
Figure 3.
Assessment of the O2-carrying capacity of the PEENPPCH. Images of 10 mL of RSSM before and after adding 100 μL of degassed DI water (Row A), 100 μL of PEs (Row B), ENPPCH (V = 0.5 cm3; Row C), or PEENPPCH (V = 0.5 cm3; Row D) for 10 min. The doses of PFOB in the PEs (25 mg/mL); or EGF (60 μg/mL) and PHMB (2000 ppm) in the ENPPCH, were all equal to those in the PEENPPCH. The pink color denotes the presence of oxygen in the region. The ENPPCH was colorless while the PEENPPCH retained pink at the 3rd min as indicated by dashed and solid circles, respectively.

