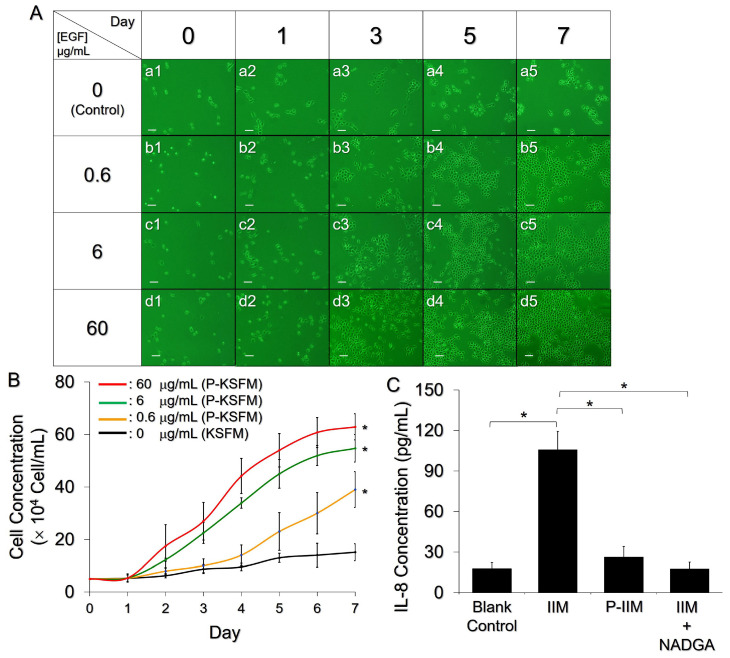
Figure 5.
Effects of the PEENPPCH on cell growth and the inflammatory response. (A) Photomicrographs of KERTr cells after treatment with P-KSFM for 0, 1, 3, 5, and 7 days, in which the PEENPPCHs were prepared with 0.6, 6, or 60 μg/mL EGF. The group cultured with KSFM alone ([EGF] = 0 μg/mL) was employed as the control. Scale bar = 50 μm. (B) The kinetic profiles of KERTr cell growth after treatment with KSFM or various P-KSFMs within seven days. Values are presented as mean ± s.d. (n = 3). * p < 0.05 compared to the group with KSFM alone. (C) IL-8 expression levels in the KERTr cells after treatment with control media, IIM, P-IIM, or IIM + NADGA for 12 h. Values are presented as the mean ± s.d. (n = 3). * p < 0.05.

