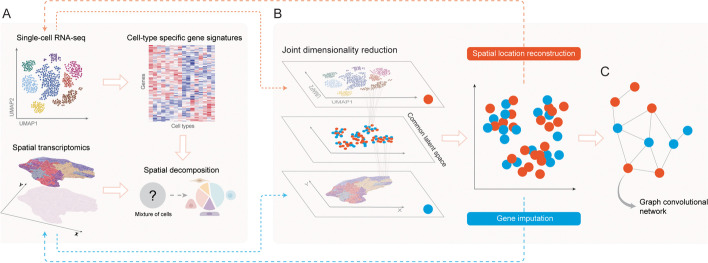
Fig. 3.
Leveraging expression profiles from scRNA-seq data and spatial patterns from spatial transcriptomics data benefits the analysis of both types of data. A In sequencing protocols where the size of the capture location is larger than a cell, multiple cells are profiled as a mixture. Cell type-specific expression profiles derived from scRNA-seq data can be used to estimate cell type proportions at different capture locations. B With both scRNA-seq and spatial transcriptomics data projected to and clustered in a common latent space, complementary information from one type of data can be used for imputing features missing from the other type, for instance, spatial pattern prediction for scRNA-seq data and gene imputation for spatial transcriptomics data. C Graphs can next be constructed based on the feature similarities in the latent space, allowing downstream graph-based methods such as graph convolutional networks. UMAP, uniform manifold approximation and projection

