
Fig. 3.
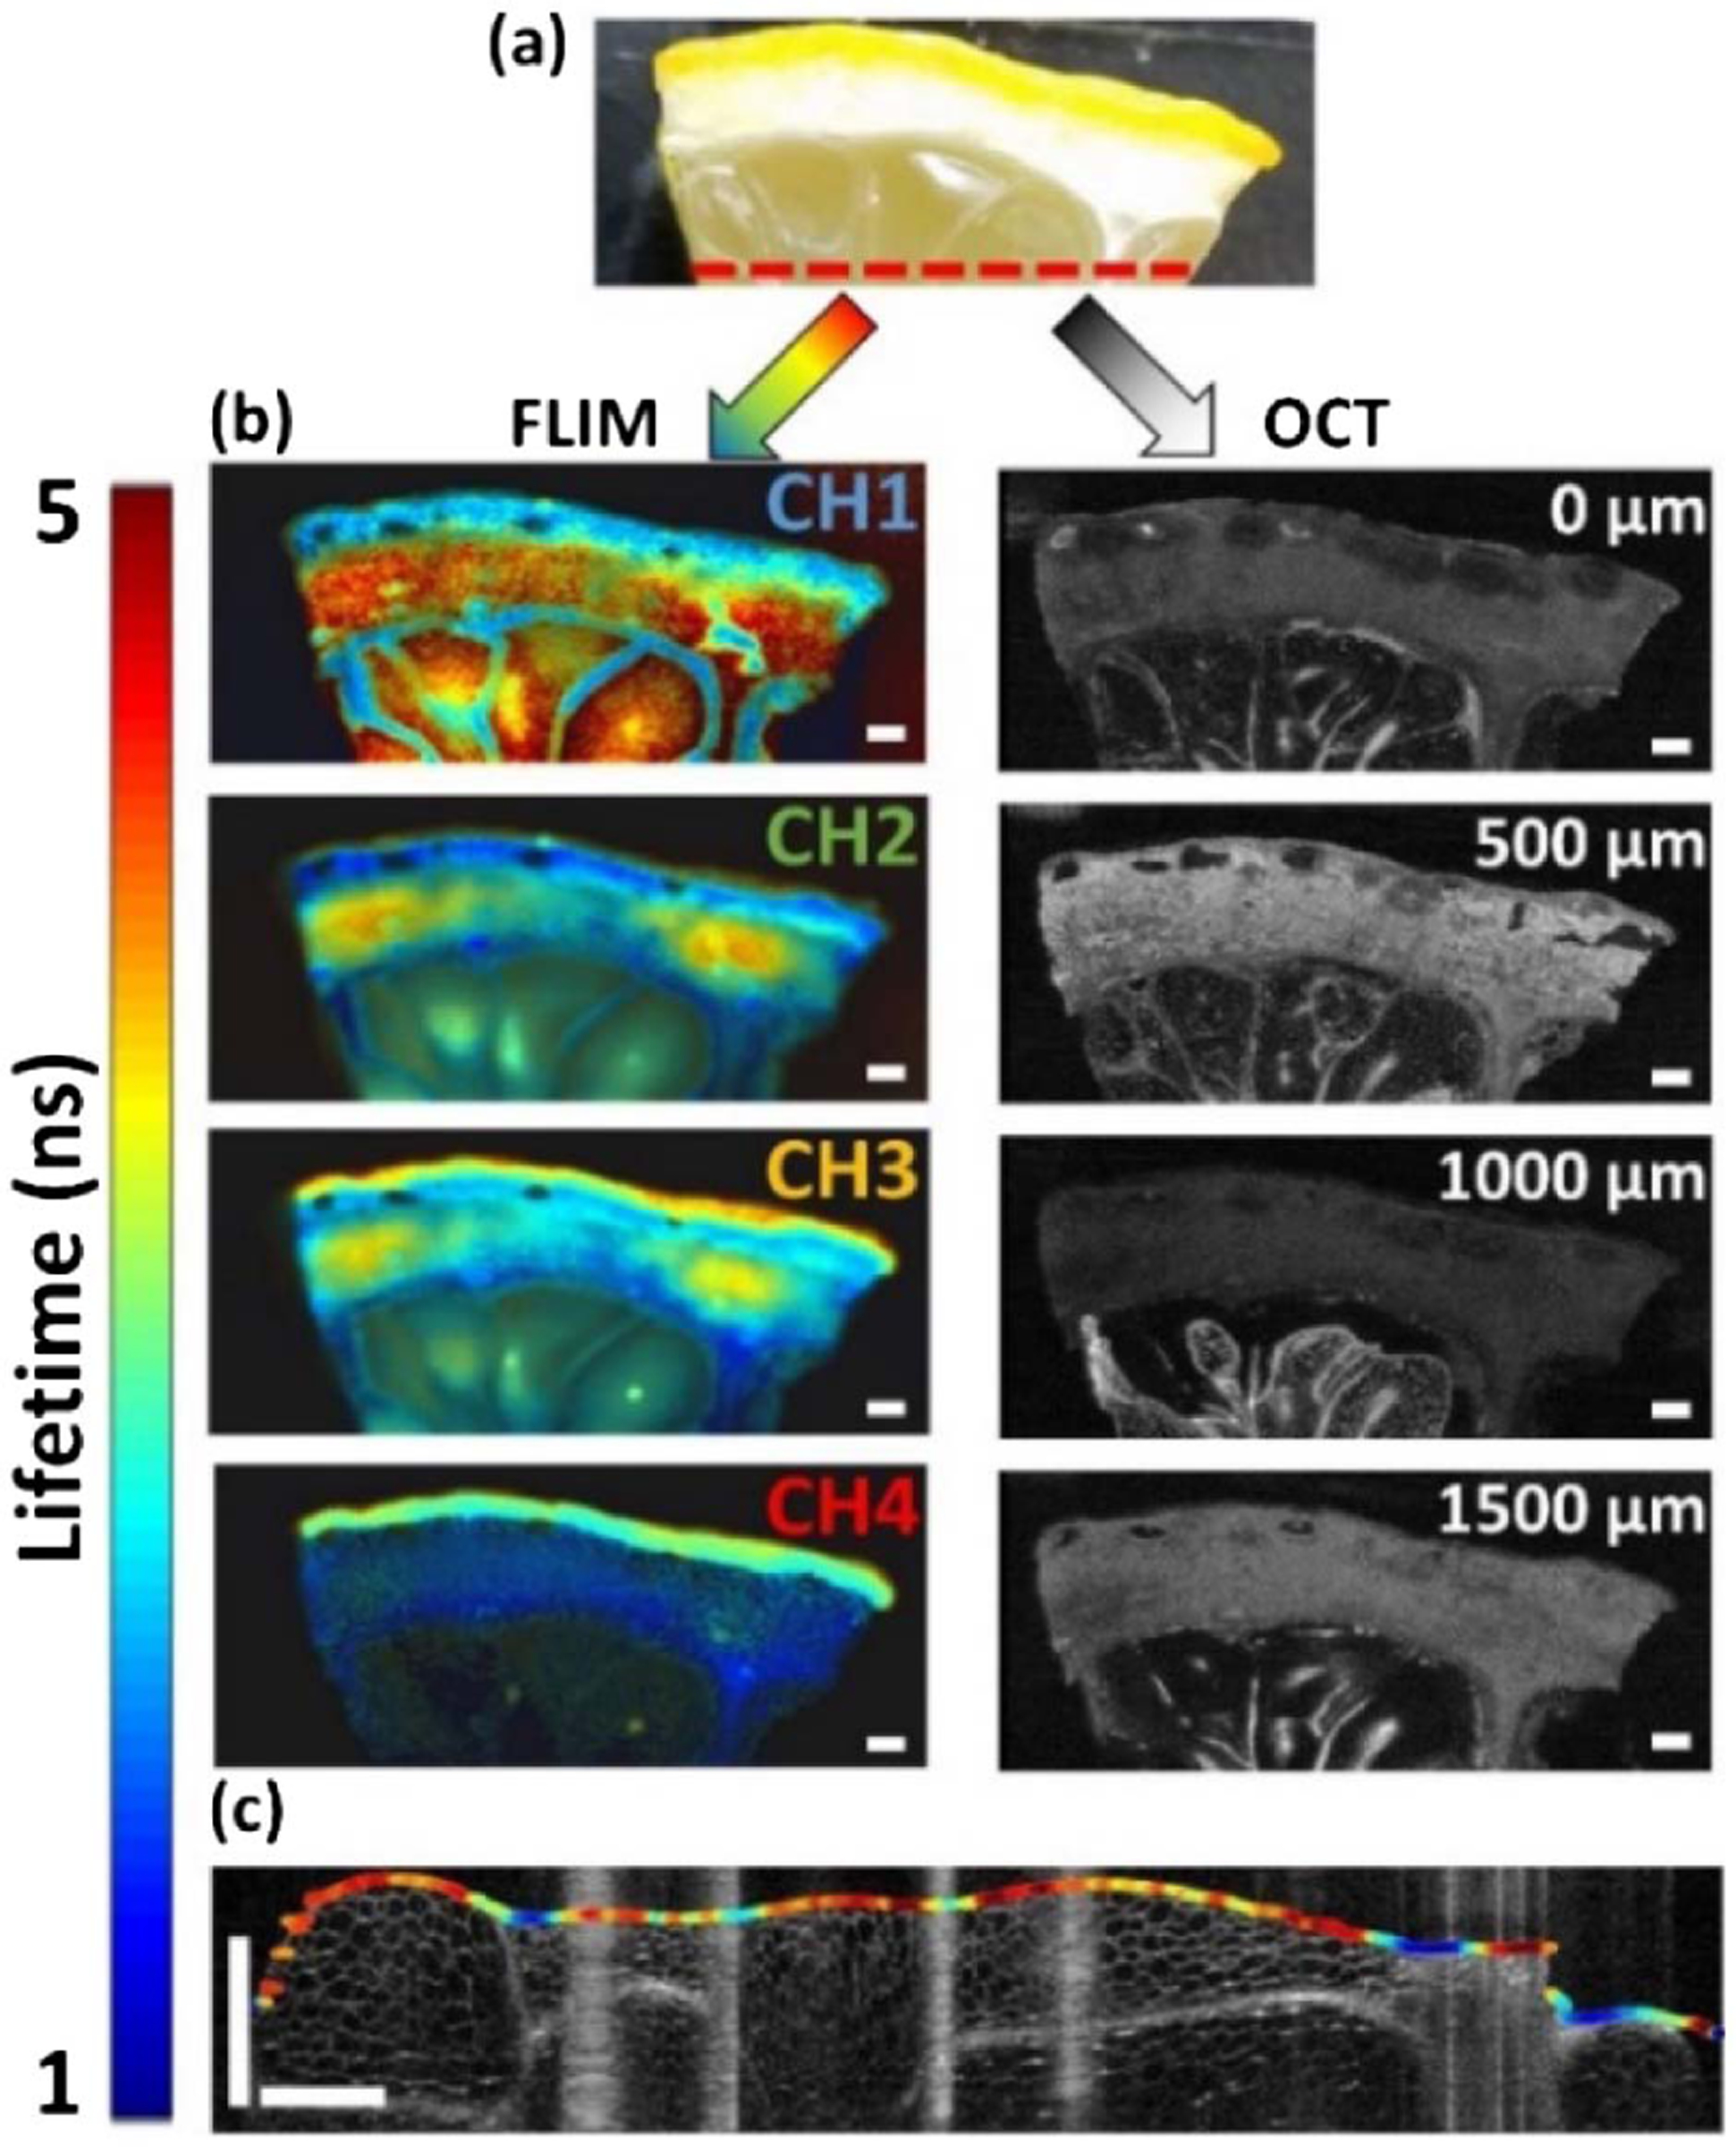
(a) White light image of a lemon segment. The red dashed line indicates the location on the sample where the data shown in (c) were acquired. (b) FLIm and OCT images of the lemon segment. The FLIm images show the fluorescence lifetime resolved in four spectral bands, while the OCT images show the lemon microstructure at different depths (see Visualization 1 for all XY OCT frames). The scale bar is 1 mm. (c) Single line scan acquired from the lemon showing CH1 fluorescence lifetime data overlaid on the surface segmented from the corresponding OCT B-scan (see Visualization 2 for all YZ OCT frames).