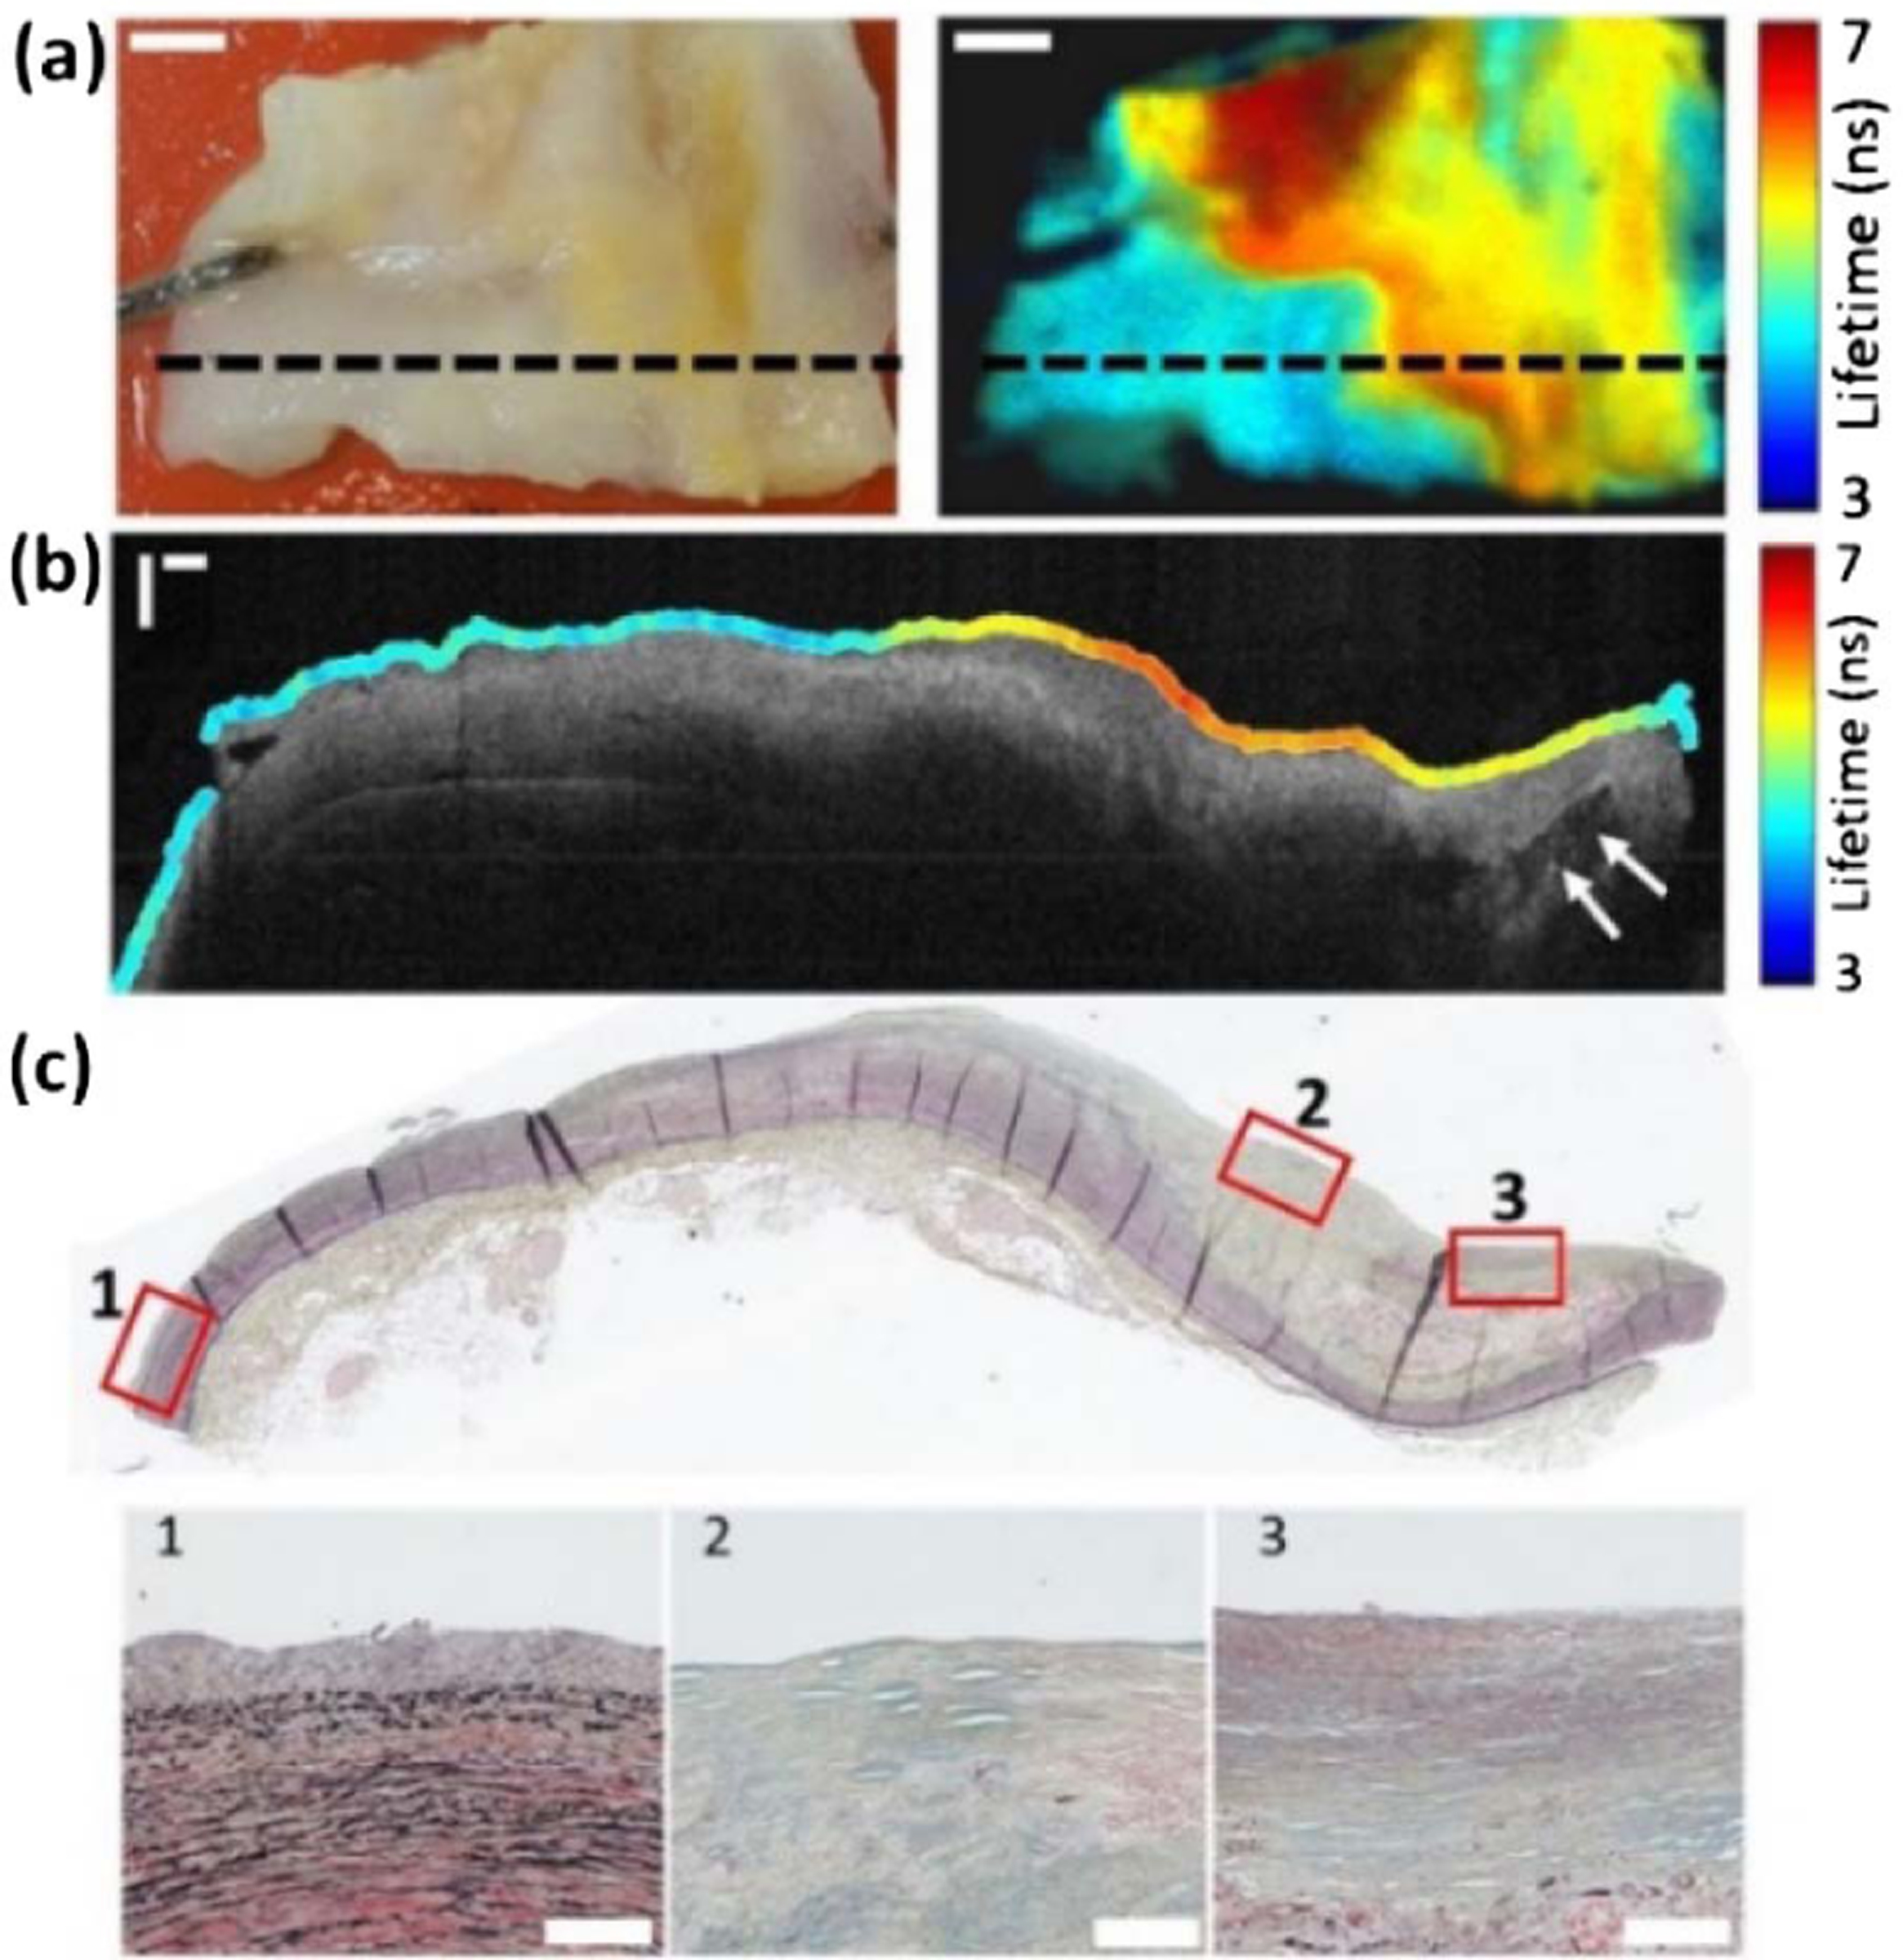
Fig. 4.

(a) White light image (left) and CH1 intensity weighted fluorescence lifetime image (right) of a coronary artery section. The FLIm image was acquired with a total of 400 × 215 pixels. The black dashed line indicates the location of data shown in (b) and (c). Scale bars 2 mm. (b) OCT B-scan with co-registered CH1 FLIm data overlaid on the sample surface. The arrows label a calcium deposit. Scale bar 500 µm. (c) Co-registered Movat’s pentachrome-stained histology section. The numbered insets contrast a non-atherosclerotic region of (1) adaptive intimal thickening with (2) acellular and (3) cellular fibrous tissue from an atherosclerotic fibrocalcific plaque. Scale bar 100 µm.
